Sentiment analysis — the 4th dimension of trading
1. What is Sentiment Analysis?
Many traders only focus on the price when looking at the market. However, all dimensions of the market must be considered for a complete analysis: Price, Time, Momentum and Sentiment.
What is the meaning of the term ‘sentiment’? How can the trader use it? How does the sentiment analysis work and which sentiment indicators should you consider?
This article will answer these questions.
2. What is sentiment?
Sentiment means the spirit of the market. It shows how the market participants assess the actual situation and the further development of a market. The sentiment tells you whether the majority of traders see the price development bullish, i.e. positive, or rather bearish, i.e. negative.
3. What are sentiment indicators
The markets reflect the mood of the masses. Movement in the market occurs when market participants buy or sell. Sentiment indicators measure this mood and quantify it.
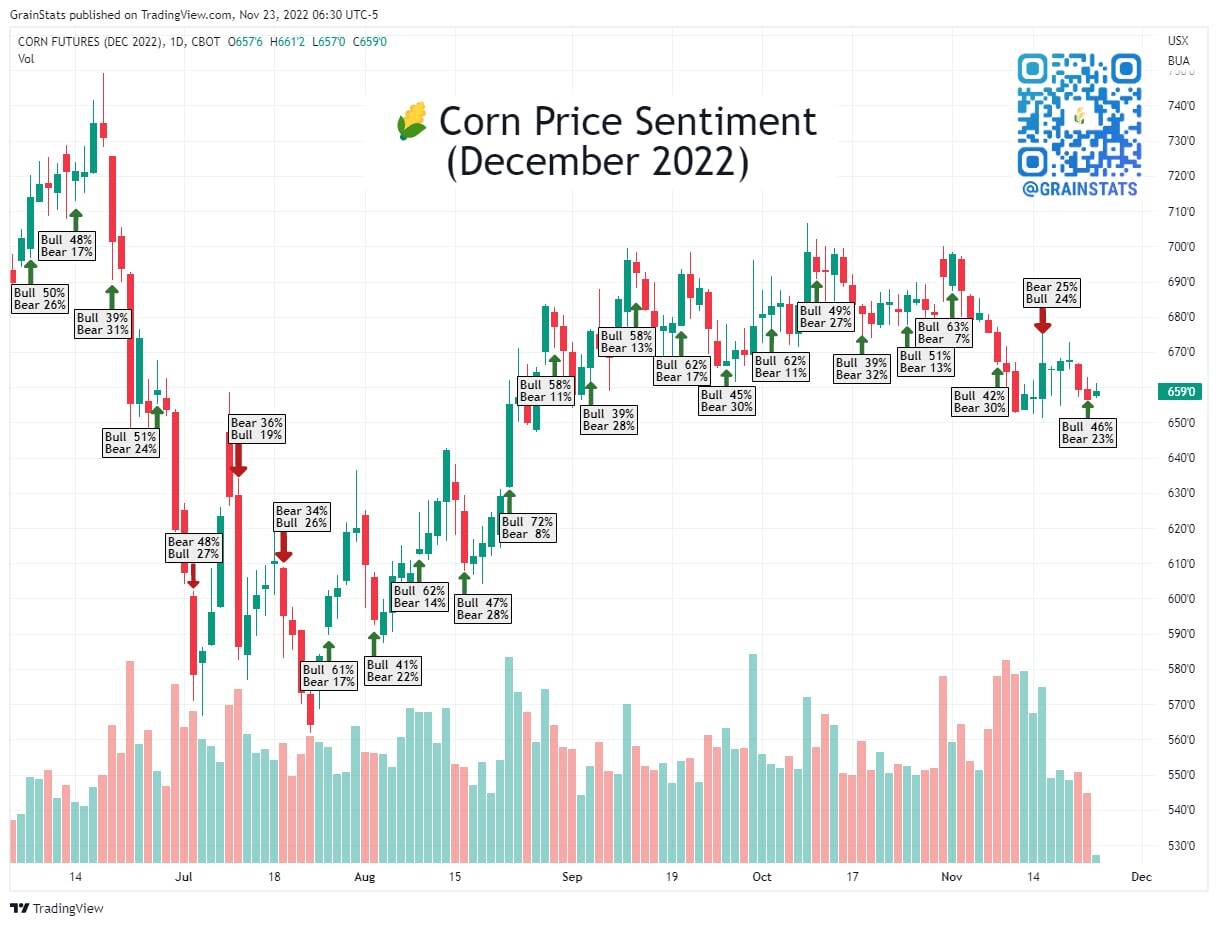
Fig. 1 Example of a sentiment indicator: Monthly survey of subscribers at grainstats.com.
Successful investors take advantage of sentiment at the stock market.
Emotions in the market range from fear to joy to greed. Indicators measure the level of these emotions. If the mood in a particular market reaches an extreme level (optimism/euphoria or pessimism/panic), the market becomes susceptible to a countermovement.
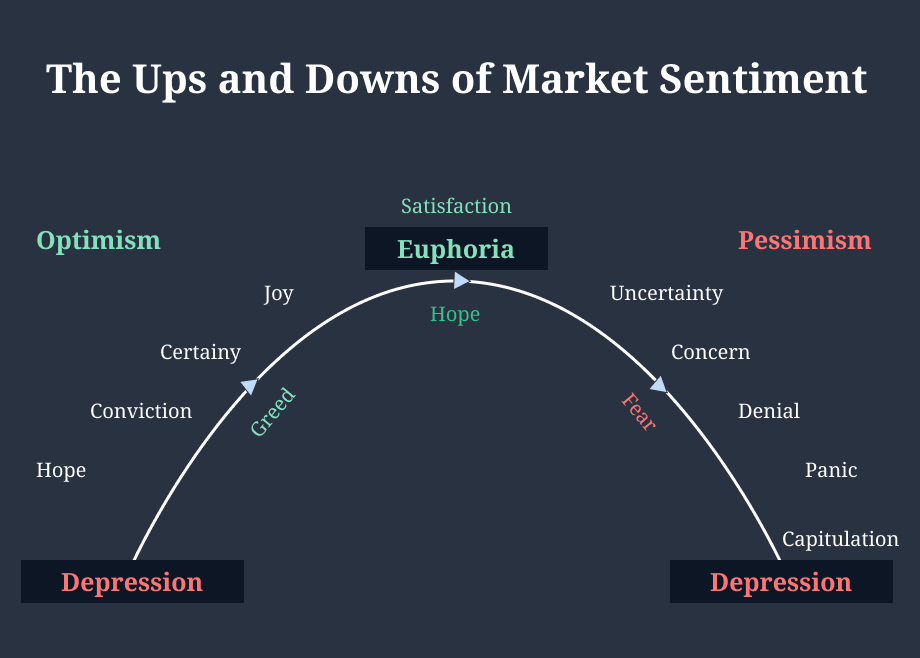
Fig. 2 Emotions and moods in the markets.
Sentiment indicators help you to identify such market peaks and troughs. The bottom of a market is reached when the sentiment values match those of a previous low.
Humans are social creatures, and we like to live and work in groups. However, in extreme market developments, this can be a disadvantage. If a market is in an upward phase and reaches a significant high, many do believe that the trend will continue. If you know that market sentiment has reached an extremum, this can give you an advantage.
4. How are sentiment indicators formed?
Basically, there are two different methods of gathering relevant data. The results are then referred to as "hard" and "soft" data.
- Hard data results from the evaluation of market positions and reflects the actual orientation of market participants. This includes
- The cash holdings of investment funds
- Insider transactions
- The Put-Call-Ratio
- The Commitment Of Traders Report
- Soft data, on the other hand, is not based on objectively determined investor positioning, but on surveys of market participants:
- Market assessments by financial market letter writers
- Investor surveys
- Articles and commentaries in trade journals and business magazines
5. Examples of Sentiment Indicators
5.1 "Soft" Sentiment Data
Surveys of active investors or specific investor groups (analysts, consultants) are used to try to gain an accurate picture of market sentiment. This type of data collection has a long tradition, especially in the USA.
Indicators can often be obtained for a (more or less expensive) fee. Examples:
5.1.1 Market Vane’s Bullish Consensus
One of the pioneers in the field of sentiment indicators. The report is published daily or weekly and can be subscribed online or via e-mail. Prices range from $15 monthly (Weekly Update via e-mail) to $45 monthly (weekly newsletter plus daily online hotline).
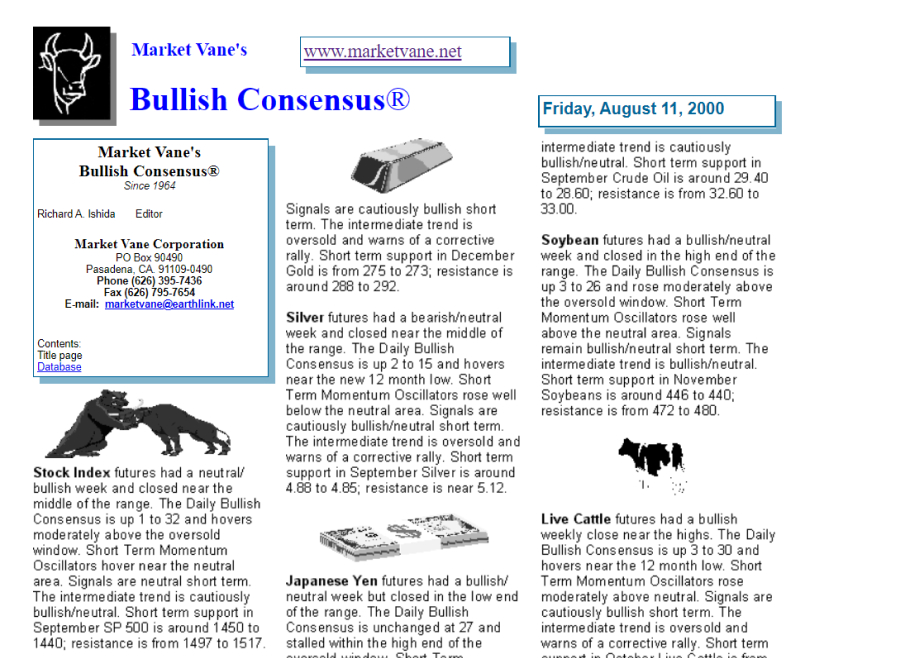
Fig. 3 Outline "Market Vane Bullish Consensus".
5.1.2 Investors Intelligence "Advisors' Sentiment Report".
The company "Investors Intelligence" is also one of the pioneers in the field of market analysis. The annual subscription of its report "Advisors Sentiment" costs $345.
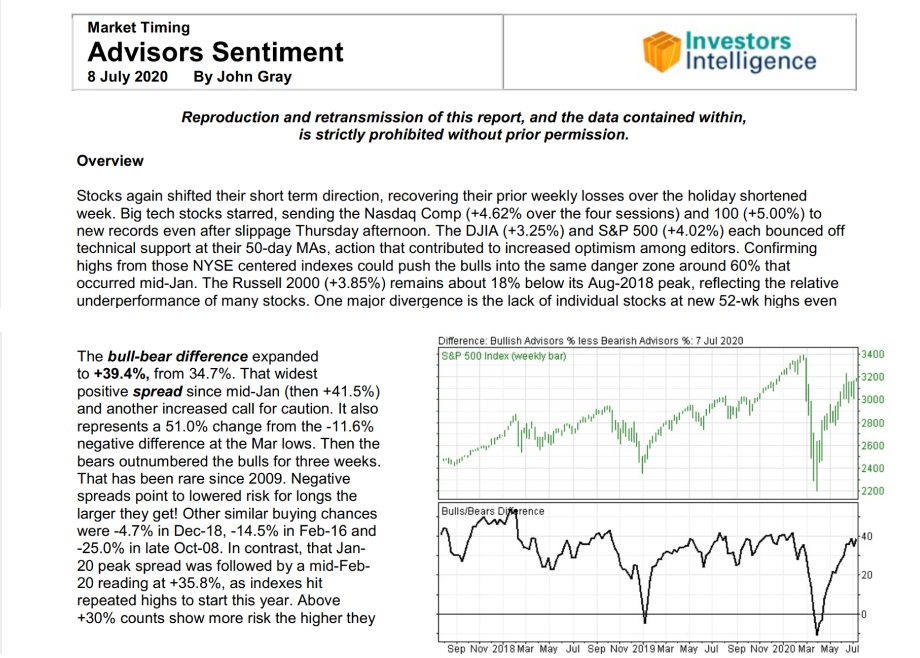
Fig. 4 Extract Investors Intelligence "Advisors' Sentiment Report".
5.1.3 sentix - a free service in German
"sentix" is a free service for German-speaking countries (http://www.sentix.de). Users who register take part in weekly surveys on different asset classes. In return they get free access to the sentiment data of these classes and to the analysis of the results.
Fig. 5 The website http://www.sentix.de.
Sentix also offers a Bitcoin sentiment report. The newsletter (now again in English) can be downloaded free of charge.
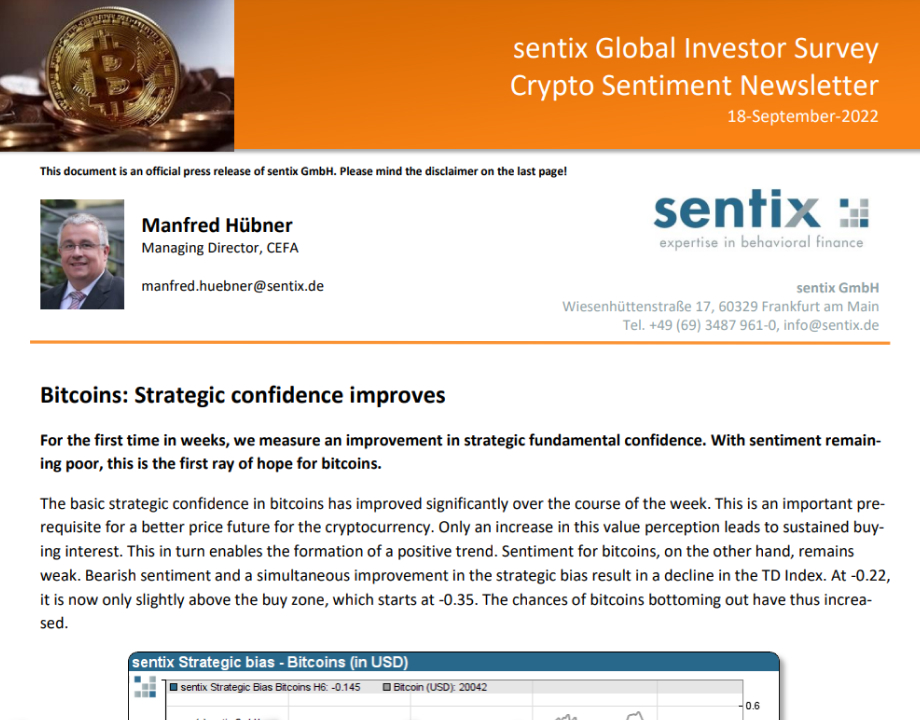
Fig. 6 Outline "sentix Bitcoin Sentiment Report"
5.2 "Hard" Sentiment Data
Hard sentiment data reflect the actual positioning of investors in the markets. They represent the active "market sentiment of the masses". Evaluating the long and short positions of market participants shows not only how the masses think but also how they act.
Sentiment indicators that present the "hard data" can often be accessed free of charge on the Internet.
5.2.1 Sentiment in Options: Put-Call Ratio (PCR)
A well-known sentiment barometer in this category is the put-call ratio indicator, which relates the number of put options bought to the number of call options bought of an underlying asset.

Fig. 7 Calculation of the put-call ratio.
For your notebook:
- A put option gives the trader the right to sell an asset at a predetermined price.
- A call option gives the trader the right to buy an asset at a predetermined price.
- Traders who buy more puts than calls indicate a bearish market
- When traders buy more calls than puts, one should look for an upcoming bull market.
If the number of traded put options equals the number of traded call options, it results as 1. However, since more calls than puts are usually traded, a PCR between 0.7 and 1.0 is generally considered to be the standard value.
- A higher put-call ratio, i.e. a value above 1, means that traders are buying more put options than call options. This indicates that a BEARISH sentiment is developing in the market.
Investors are either speculating that the market will move lower, or they are hedging their portfolios in case of a sell-off. - A low put-call ratio, i.e. a value below 0.7 and close to 0.5 is considered a bullish indicator. It means that more call options are bought than put options.
Due to extreme fluctuations of the curve obtained this way, most traders place an average line (for example SMA 5 or SMA 10) over it to smooth the indicator. The question of where to locate the relevant extreme areas should be determined visually based on the history of last couple of years.
The indicator can be found, for example, at barchart.com (with different calculation bases) or tradingview.com.
.png)
Fig. 8 "Total put-call ratio ($CPC) since the beginning of 2018 with smoothed MA(10) Chart:barchart.com.
Sentiment indicators are always used as contra indicators. Therefore, a high put-call ratio makes us look for a bullish market, but a low one makes us look for a bearish market.
I will come to the explanation for this below.
5.2.2 Sentiment in Futures: the Commitments of Traders (COT) Report
Another helpful tool for capturing market sentiment is the Commitments of Traders report published by the CFTC (Commodity Futures Trading Commission).
This weekly market report is freely available on the internet (https://www.cftc.gov/MarketReports/CommitmentsofTraders/index.htm) and serves us here at InsiderWeek as the fundamental basis for our trading decisions.
Since almost EVERYTHING on our website revolves around the COT report, here is just a brief description of the report.
The COT Report lists the long and short positions of market participants in the futures markets, broken down by trader groups. Various versions of the report exist. The original form is the so-called "Legacy Report," which has a history dating back to the 1990s for some markets.
This report distinguishes three groups of market participants:
- Commercials - these are the commercial traders, the producers and processors of a commodity. They use the futures markets to hedge against price fluctuations.
- Large Speculators. They are the counterparties of the commercials. Institutional financial traders, banks, fund companies or even insurance companies can be found in this group. They act purely speculatively and want to earn money from price fluctuations.
- Non Reportables. The two groups just mentioned are obliged to report their purchases and sales to the CFTC once they reach a certain position size. The Non Reportables, also called Small Speculators, are traders whose position size does not exceed the limits of the reporting obligation.
For the futures trader, the behavior of the commercials is interesting. They usually trade counter cyclically. If the price of a commodity rises and the commercials start to build up massive short positions (or reduce long positions), traders should keep their eyes open: it would then be possible that a trend reversal is coming to the end.
The Large Speculators are the antagonist of the Commercials. They are trend followers and their position chart is the mirror image of the commercials.
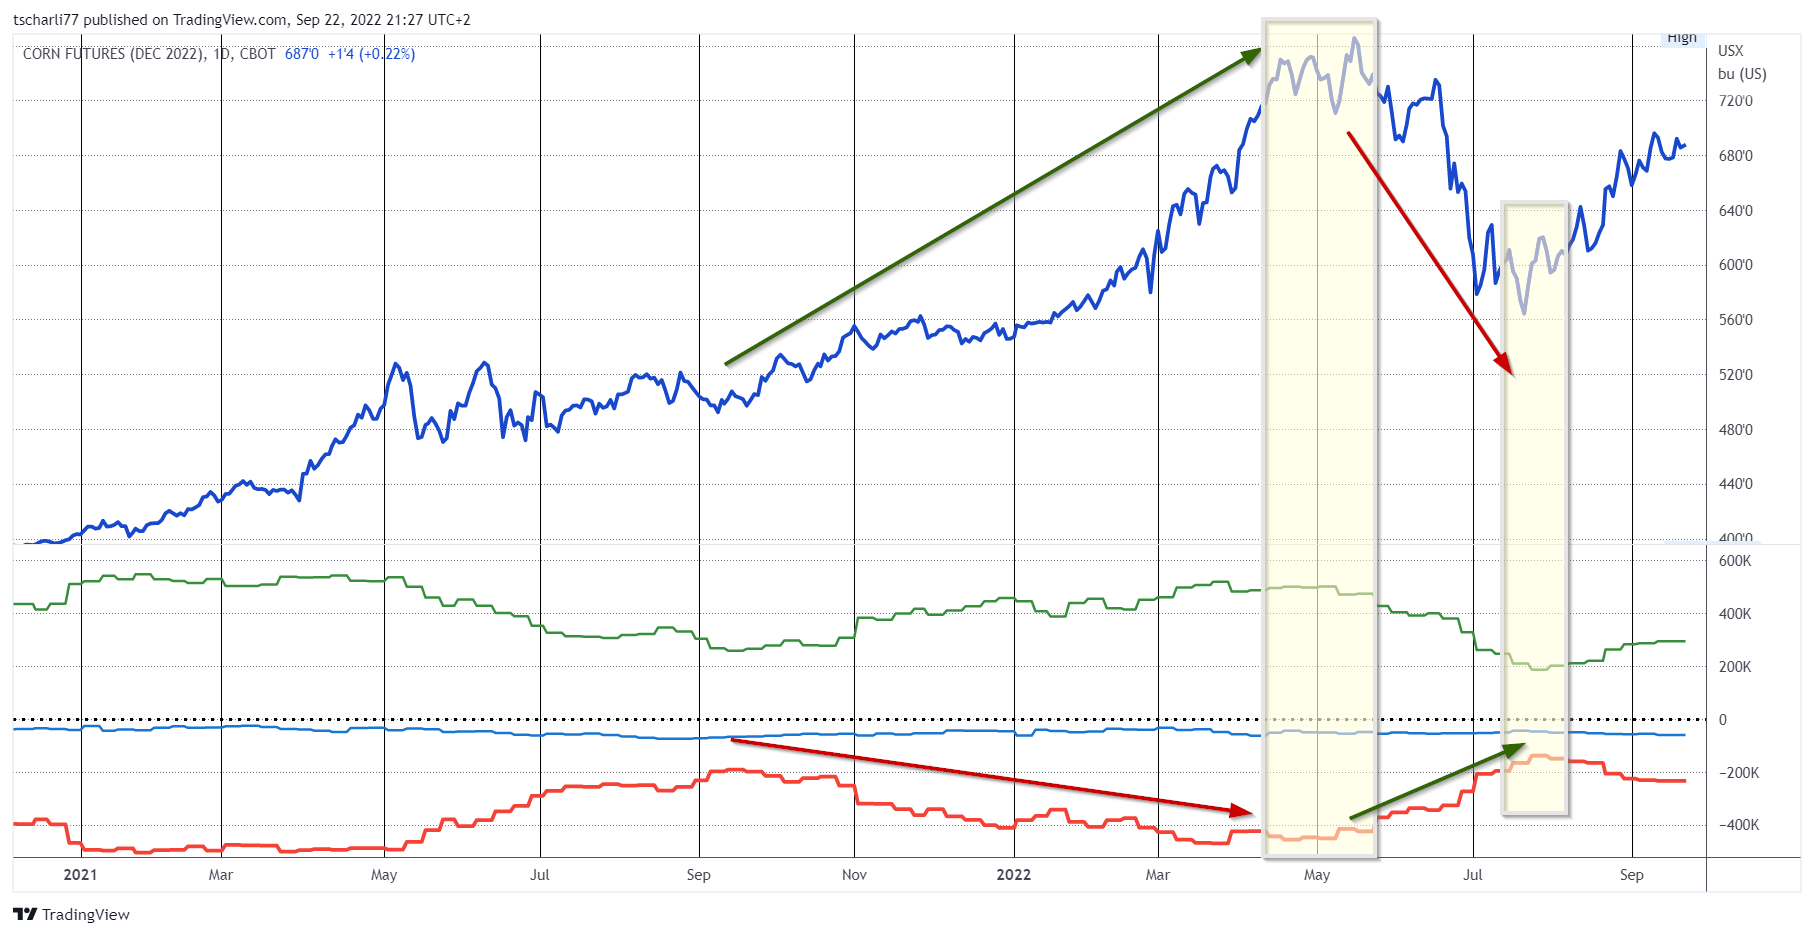
Fig. 9 The Corn Future December2022 with COT Net Positions of Commercials (red), Large Speculators (green) and Non Reportables (blue)
The chart shows the price trend of the Corn Future December2022 (ZCZ2022) over two years with the net positions (long - short) of the three trader groups Commercials (red), Large Speculators (green) and Non Reportables (blue).
You can see the mirror image of the blue and red curves and also that the Non Reportables, i.e. the "small speculators", hardly play a role. The number of their contracts is so small that they have little influence on the price.
6. How do you use the sentiment indicators for your trading?
6.1 Sentiment indicators for countercyclical trading
When a market has been moving in one direction for a long time, news and reports about that market almost always agree with the trend. On the surface, it now seems nonsensical to trade against this trend. And "trend followers" often „jump on this bandwagon" even now.
But here sentiment indicators can help you to stay objective. Because extreme sentiment readings correspond with extreme news. And you know that sentiment is now in a range where a change in trend is likely,
Warren Buffett once put it in a nutshell:

Fig. 10 The credo of countercyclical trading: Warren Buffet
6.2 Are the masses always wrong?
If you look around on the internet on various trading sites, you will often find statements like "80 (or 85/90) percent of all traders are not successful".
*So does that mean that the majority of traders is generally wrong?
The matter is not quite that simple. The explanation is different: those traders who expect rising prices have already implemented this expectation with purchases.
*But if the overwhelming majority has already bought, then, at a certain point, there is simply not enough buying pressure to drive the market even higher.
So the upward movement will slow down and eventually come to a complete halt.
The same principle applies, of course, in a downtrend. If most investors have already acted on their fear of falling prices by selling, there is no further selling pressure and the bottom is not far away.
So the majority is not wrong per se. Rather, it is precisely this majority that makes a decisive contribution to the establishment of a trend. And it accompanies it over long stretches.
However, if the number of optimists (or pessimists in a downtrend) has reached an extreme level, it is advisable to look for a possible trend reversal.
7. Sentiment Analysis in Futures Trading with the COT Report
How can you use these sentiment indicators for your trading preparation? I will explain this using the COT data.
The Commercials dominate the playing field
While interpreting the COT data, we focus on the Commercials. They "live" on commodities and have the best knowledge and insights into the supply and demand situation of the markets. They use the futures markets to hedge against price fluctuations in the cash market.
As a rule, therefore, commercials act countercyclically.
We again take a step-by-step look at the December2022 corn futures (ZCZ2022) with the net positions of the commercials:

Fig. 11 Corn December2022 plus Net Positions of Commercials
At the beginning of 2021, the commercials are extremely net short (approx. 500,000 contracts), while prices are rising. The commercials remain on their positions in a watch-and-wait mode.
- Prices peak in May and remain in a range until late fall. At the same time, commercials gradually reduce their short positions. They obviously expect prices to continue to rise.
- This case actually occurs in late fall, after the corn harvest. The drought of 2021 has taken a toll on corn crops. Prices climb to record levels by spring 2022. Commercials, however, begin to build short positions. They are building ahead of a price decline.
- And this price crash comes in spring 2022. Prices fall to the previous year's level. The commercials close out their short positions as prices fall. At the end of July, they have reached a new record level of about 140,000 short contracts.
- At the same time, with the beginning of the 2022 harvest, prices start to rise again. And the commercials are building up shorts again.
8. Conclusion
- Sentiment indicators reflect the market mood. They are a "psychological guide", not mathematical laws. A sentiment indicator must never be considered on its own and used as the sole basis for a trading decision.
- Neither are sentiment indicators timing instruments. The sentiment indicator shows the direction in which the market is most likely to move. However, whether this movement will occur tomorrow, next week or in a month's time cannot be read from it.
- A sentiment indicator is a fundamental tool that can provide traders with important information. However, this information must be verified and critically evaluated with the help of other tools. Otherwise you as a trader can experience nasty shipwreck!
- We always use sentiment indicators as contra indicators. If the crowd in the market is bullish, we become alert and look around for the incipient trend reversal.
- If the market sentiment reaches a peak (in bullish or also in bearish direction), this is a sign that the market has a certain saturation. When the bulls are in the absolute majority, there is no longer enough buying pressure to drive the market much higher. The same is true in the short direction.
*All prices as of the end of 2022!
Curious to learn more?
Get your hands on Max Schulz’s book by downloading it today! Free of charge.