COT Report Online With Free Charts
What is the “COT Report” and what exactly does it tell us? How do we evaluate it and how do we use COT data for our trading preparation? This article will give you the answers to those questions.
What is the Commitments of Traders (COT) report?
The Commitments of Traders (COT) report is an exchange report that is published weekly by the American Commodity Futures Trading Commission (CFTC).
The CFTC was created by the US Congress as an independent authority in 1974.
It has the mandate to regulate the commodity and options markets in the United States. Through this oversight, the CFTC ensures that the futures markets perform two important functions: pricing in the commodities sector and reducing price risk in the futures and options market.
The report presents the US futures as transparent financial instruments and thereby creates fair competitive conditions for all large and small traders on the futures markets.
It is usually published at market close (at 21:30 CET) on a Friday on the CFTC website and presents the positions of the market participants subject to reporting requirements. These positions are reported by brokers to the CFTC for analysis and verification. The data refers to the market situation at market close on Tuesday of the relevant trading week.
What information does the report offer?
Firstly, one thing must be clarified: There is no ONE COT report. Instead, there are a number of different formats that have evolved over time since the beginning of reporting. They also highlight special areas of the futures markets, such as the Traders in Financial Futures report (TFF), which covers traders in financial futures contracts such as currencies, US Treasury securities, Eurodollars, stocks, VIX or the Bloomberg Commodity Index.
In this article, I will deal exclusively with the Legacy Report, the report originally broken down by exchange and, specifically, we will regard the “Futures Only” report, not the “Futures and Options Combined” report.
After downloading the current report from the website of the CFTC, you will see the following picture. (click on the picture to zoom)
The long and short positions of the three groups of market participants can be seen (note: a special feature is the “spreads” value of the group of non-commercials, which we are not interested in at the moment). The report also shows the total open interest in this market.
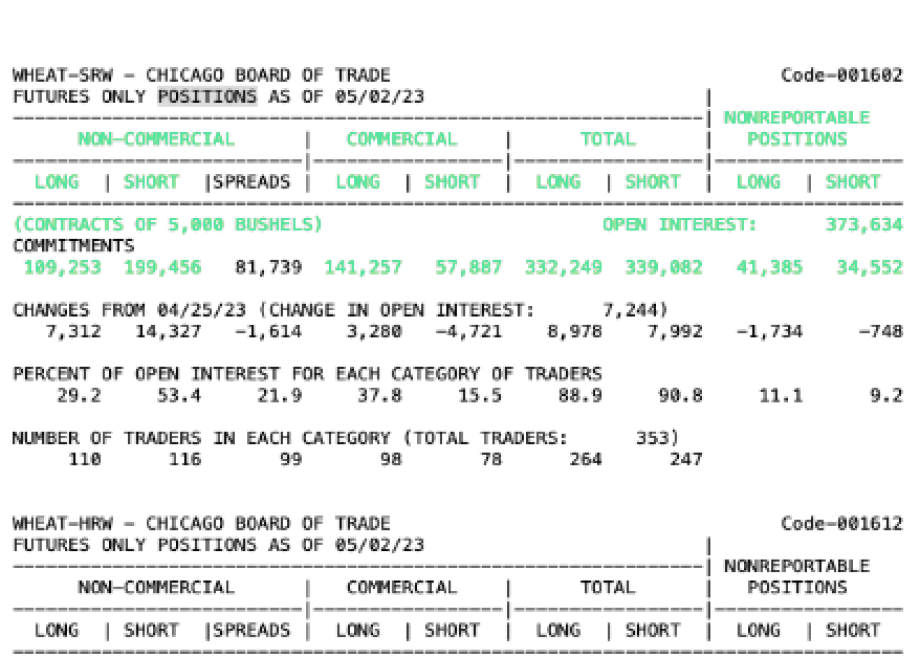
Fig. 1: CFTC Commitments of Traders Short Report – CBT (Futures Only)
What groups of market participants can we find in the COT report?
There are two major groups of market participants active in the market: commercials and non-commercials. Non-commercials are also known as large speculators. These two groups are the reporting agent traders, known as reportables. The third group, the non-reportables (often referred to as small speculators or small traders) is calculated by subtracting the total number of long or short positions in the reportables from the total open interest.
Commercials aka the hedgers
The term “commercials” refers to market participants who operate on the futures markets primarily for hedging purposes. Another term for commercials is hedgers. They are typically manufacturing or processing companies that wish to hedge against price fluctuations on the futures market in order to avoid dependence on commodity prices. Commercials do not speculate. They want to protect themselves by opening positions against price expectations.
A commercial produces a product and therefore has a larger stock of the product, or needs the product for his business. Commercials could be, for example, large agricultural cooperatives or multinational production companies (Nestle, Procter & Gamble, etc.)
Non-commercials aka the large speculators
The non-commercials are different. These are the market participants who conduct speculative transactions on a large scale. Typically, this would be the institutional traders, hedge funds or large investment banks, all of whose positions exceed the limit of the reporting obligation.
Non-reportables aka the small fish
The figures for non-reportables are calculated by deducting the totals of the reportables from the total value of open interest. Non-reportables are those market participants who are not subject to reporting requirements, in other words, they are “small traders like you and me”. However, they could also be trading companies (small banks, trading houses), which do not exceed the defined limits on traded contracts.
How do we use the report for our trading?
The report is analyzed for the net positions
We use the COT report as a source of basic information for our actions. However, in the form in which it is available from the CFTC site, it is not very helpful. Compare it to Figure 1, where the raw data must first be evaluated. Let’s take a look at the net positions of the commercials.
The result comes from the difference between the long and short positions of the report. From the example above, we can see:
Net position = 113,175 – 128,957 = – 15,782
which means 15,782 contracts net short
We then present these net values graphically in order to get an overview of the development, and especially the changes of the positions.
Significance of the net positions in terms of the commercial index
After calculating the net positions, we are already one step further, but have not yet reached our goal. The net position itself does not tell us anything about how the commercials have actually positioned themselves. If we only know that the commercials are 15,782 contracts short this week, that does not help us much.
How should this figure be interpreted? Are the commercials now extremely short or are they actually in their normal short range?
We need an indicator that lets us evaluate this figure. And we get it by relating the current position to the positions over a certain period. So, we calculate an index that allows us to evaluate the current position as a percentage:
We calculate the commercial index (as a fixed period, we are looking at three years here):
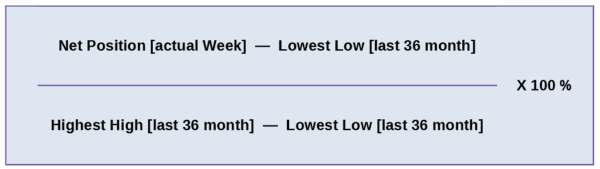
Fig. 2: COT Commercial index as a formula
With the help of this calculation, we now have some informative value of the current net position, which serves as the basis for our trading.
Why do we pay so much attention to the commercials?
Commercials produce commodities and supply the world market with them. Or they need the commodities in large quantities for their business. The existence of these people depends on the commodities, and of course on the commodity prices. Because of their direct link to commodities, the commercials will predict future price developments much earlier than other participants in the market – and hedge against them.
Commercials usually trade counter cyclically. Their positions allow an inference to be drawn about the expected market movement. This data does not serve as a timing instrument, however!
In other words: Just because the commercials are now moving extremely short does NOT mean that we’re going to go short tomorrow. But it is an indication of a market situation that tends to change. It is now advisable to analyze this market and watch it closely, because there may be movement here soon, which we can then use to our advantage.
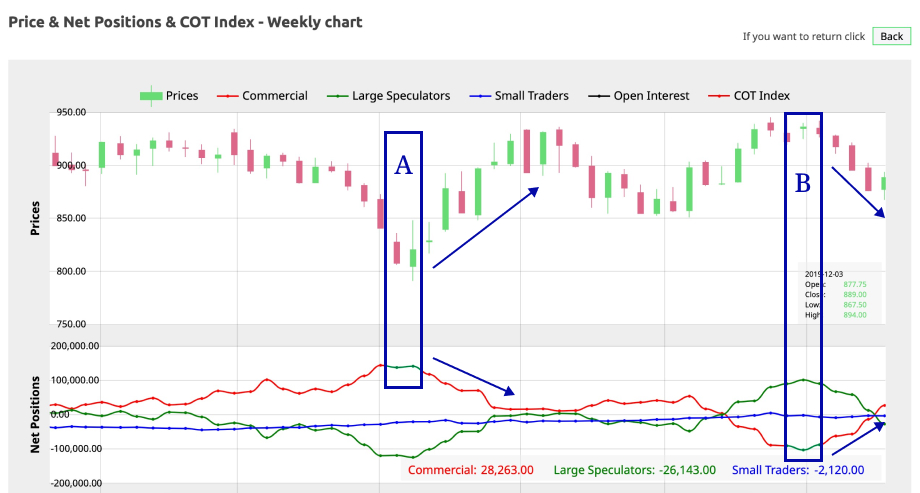
Fig. 3: COT Commercial index as a formula
A specific example: Soybeans 12/2018 – 11/2019
You can see the price on the soybeans market and the net positions of the three groups of participants (weekly chart). Look at the net positions of the commercials (red line) and the soya beans price at points A and B and the subsequent price development.
How to follow our trades?
In January 2023, we launched our membership, which allows you to observe how we make trading decisions in real-time.
With our new Pro Trader subscription, you get hands-on experience. We provide transparent insights into our trading activities on both our StartUp and COT-1 accounts, utilizing the COT Report. The trades executed on the StartUp account are ideal for traders with smaller accounts (around $30,000), while the COT-1 account caters to professional traders with larger accounts. All trade entries and exits on these accounts are announced and executed in advance. At the end of each trading week, we evaluate and document all implemented trades in a publicly available trading statistic, ensuring complete transparency.
Click the button below to access more details and join our membership.
Trade with mePlease note that while a subscription offers an inside look into our team's trading practices, you are solely responsible for your portfolio. It's important to be aware that a trade may require multiple entry attempts. It is up to you to manage the risk by using stop losses. We can only share our experience and insights with you.
We wish you profitable trades and the continued development of your trading strategy!