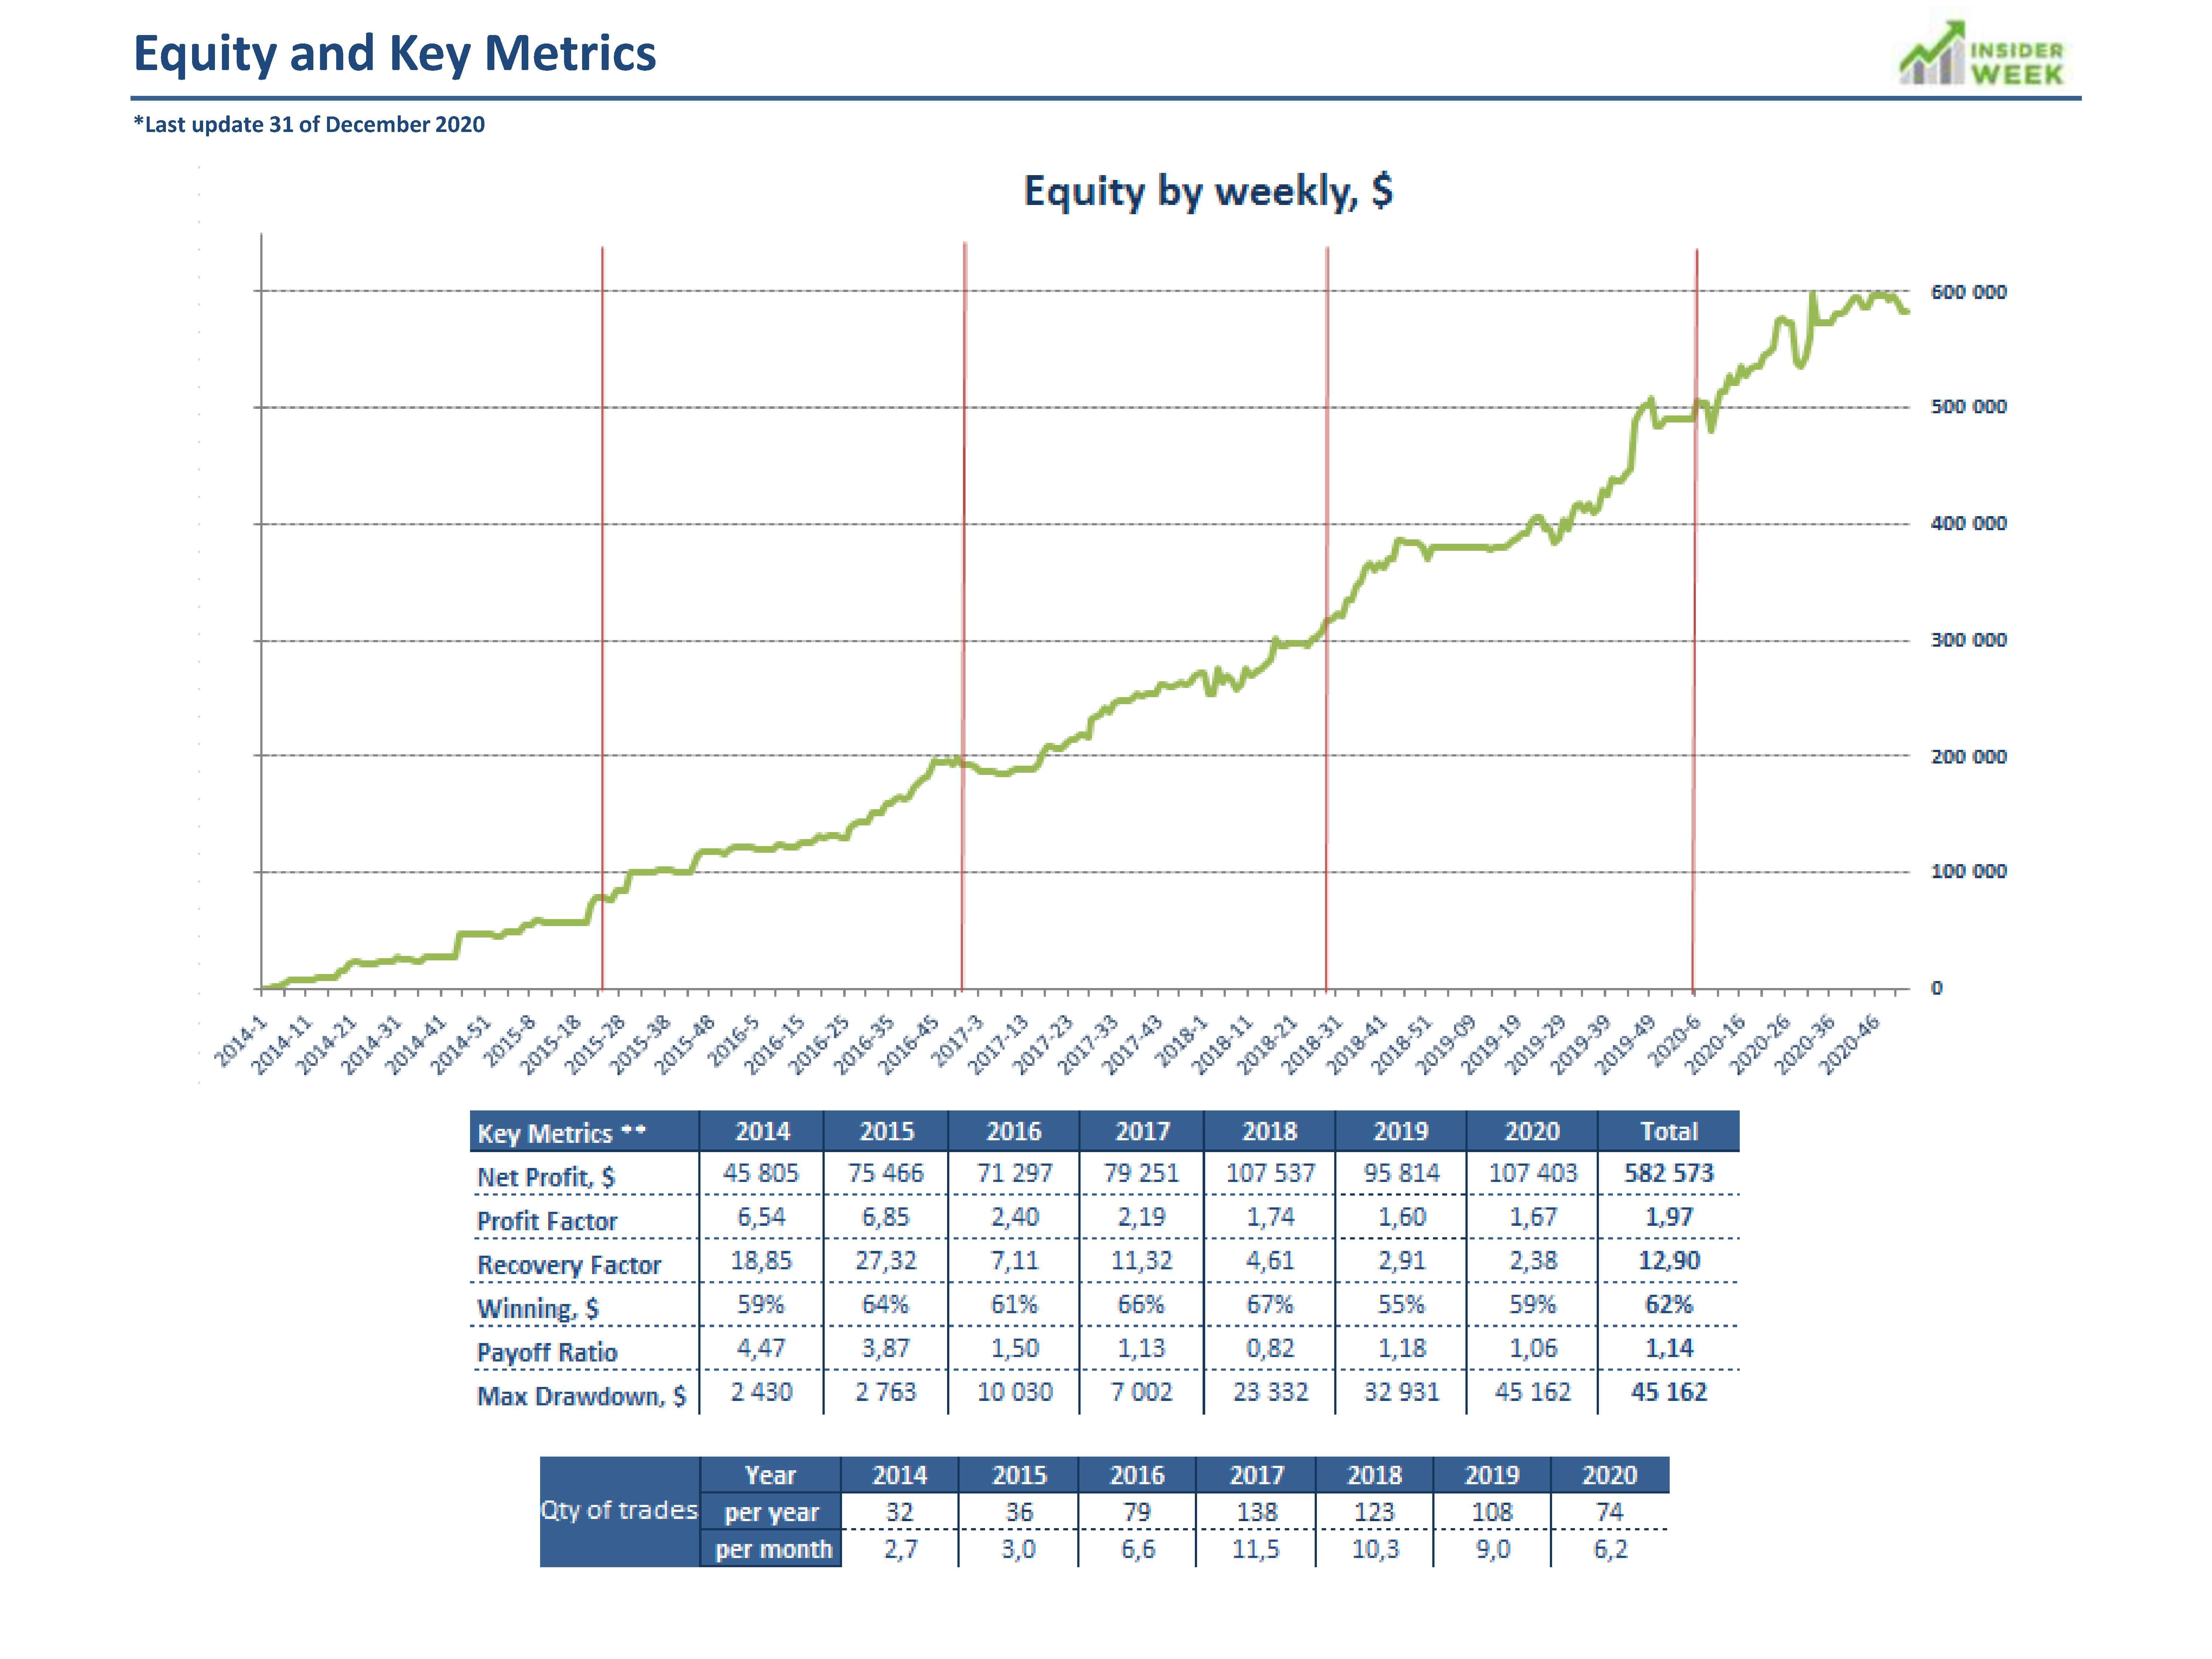
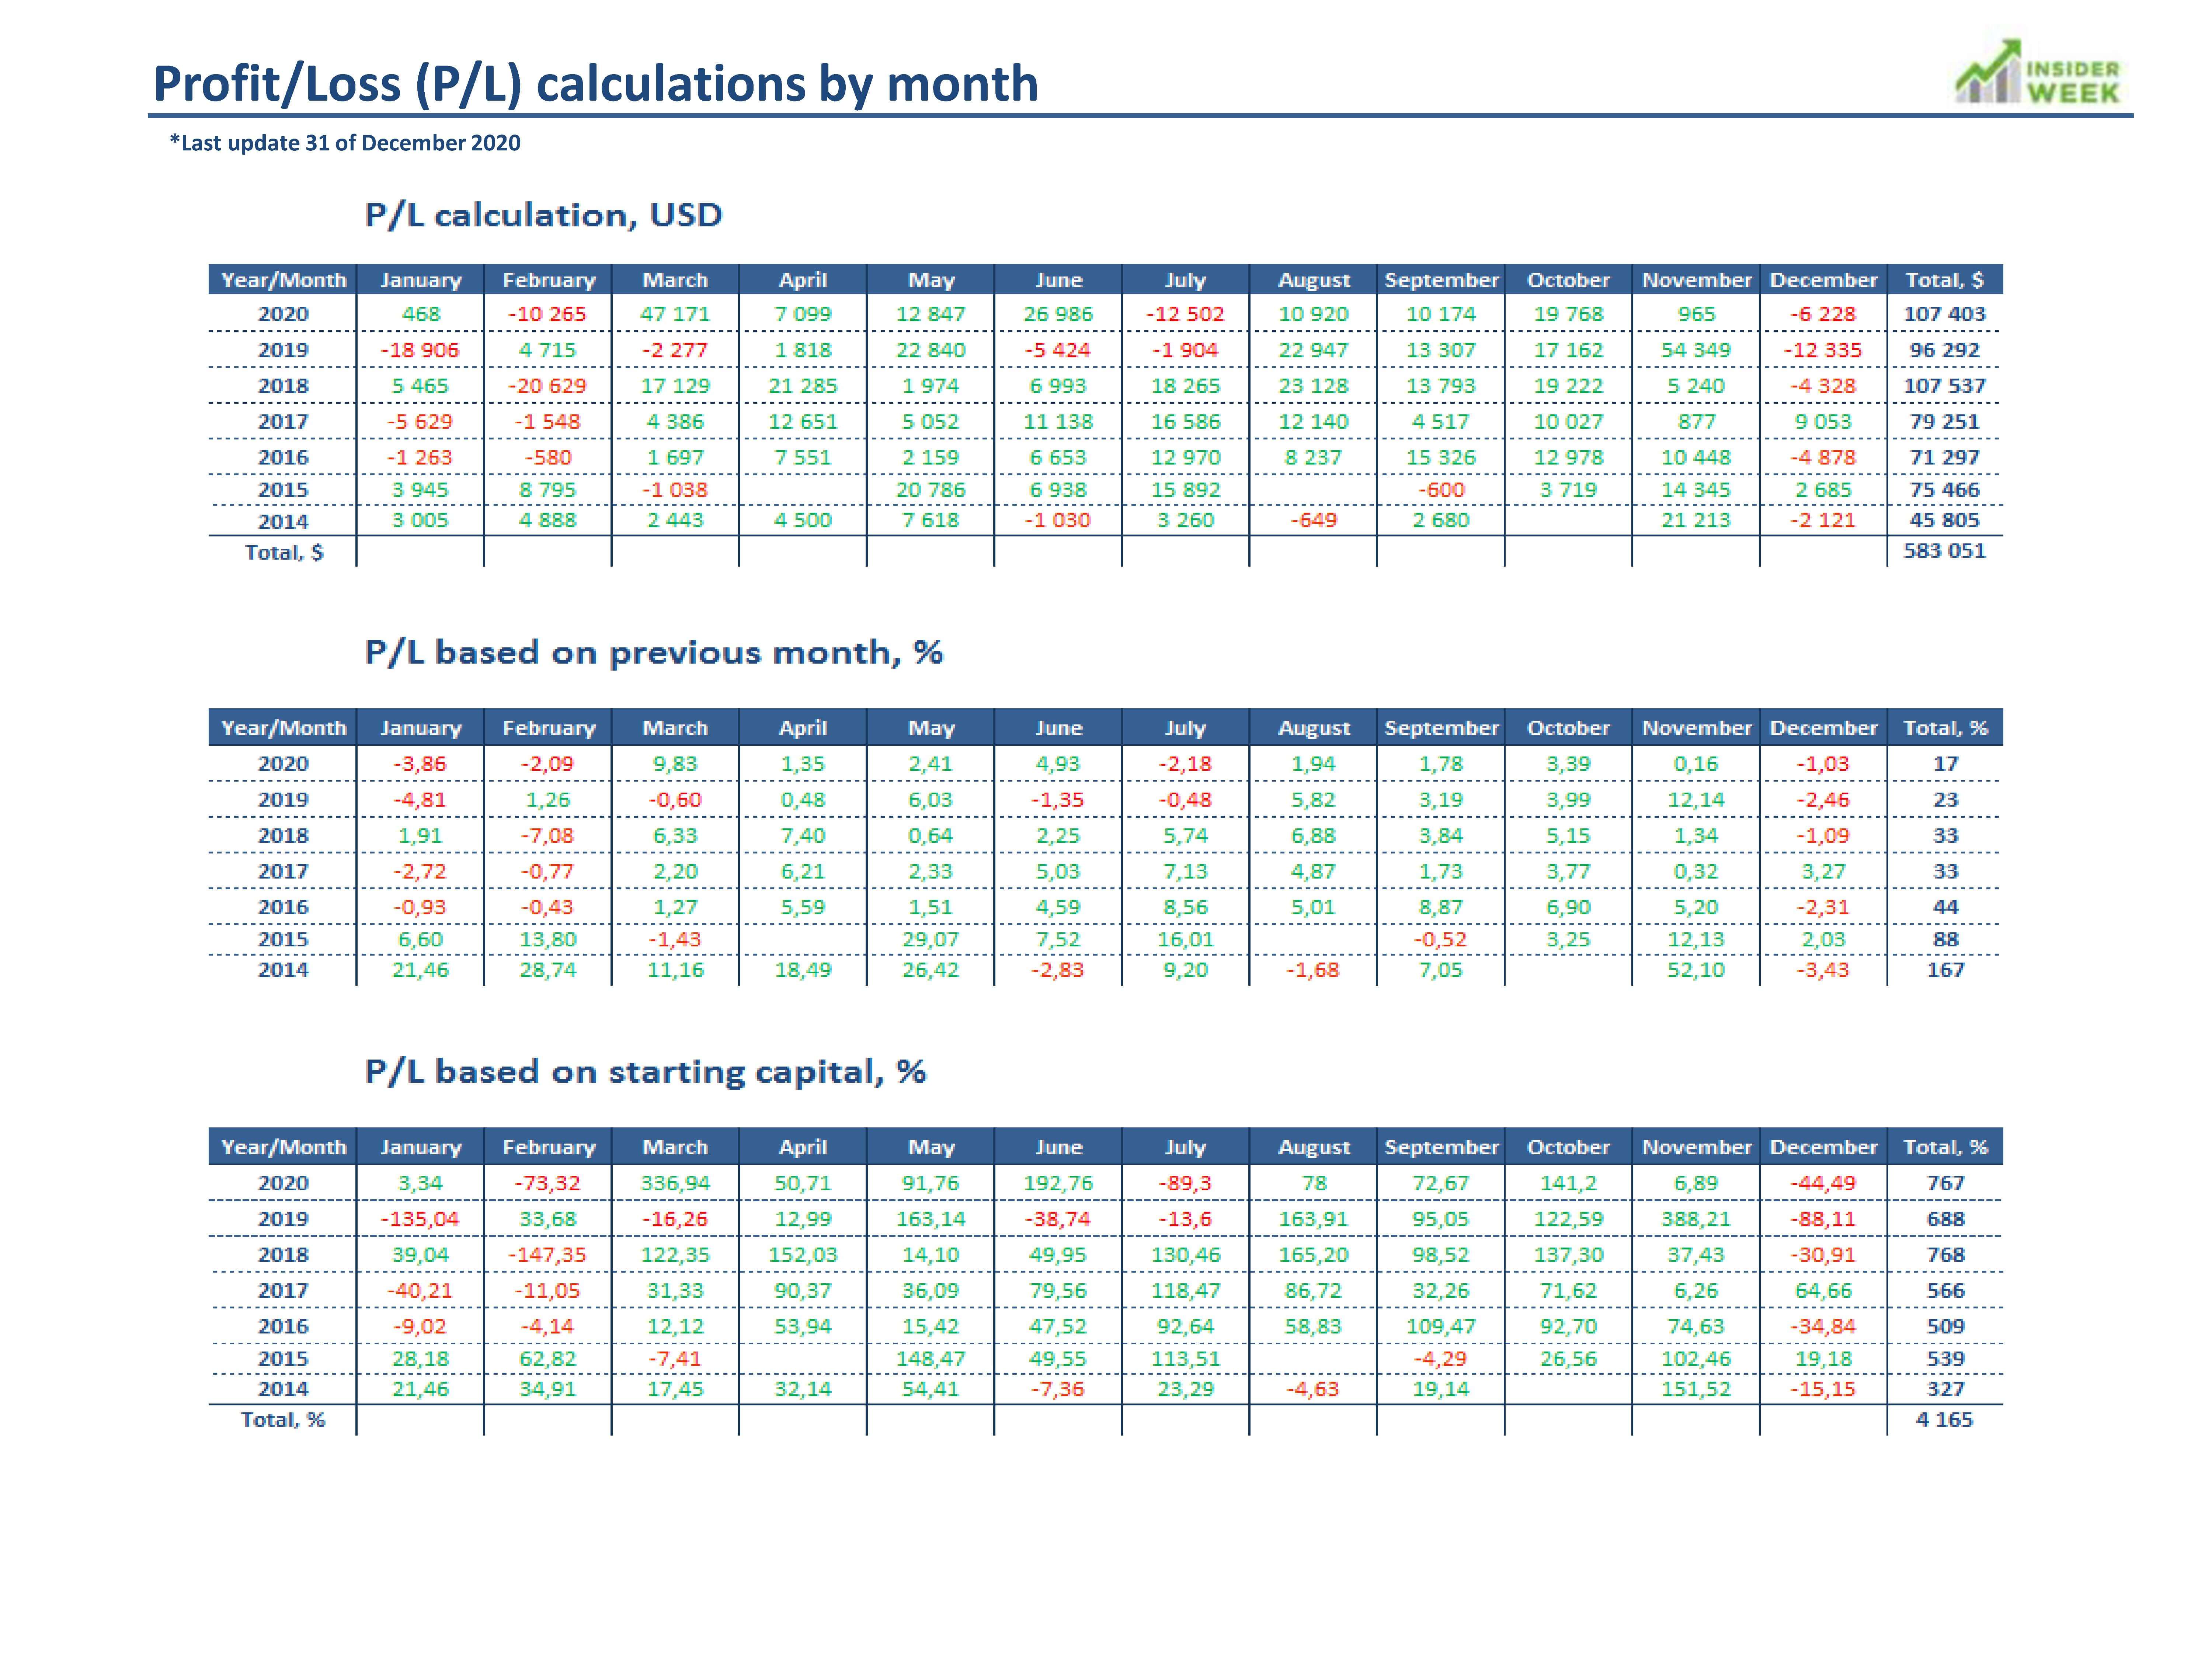
Performance
Max Schulz has been totally transparent in publishing his trades since 2017. His overall annual returns average 77% with a whopping 156% in his best year. What’s more impressive is that he has accomplished all this with a maximum drawdown of under 10%.
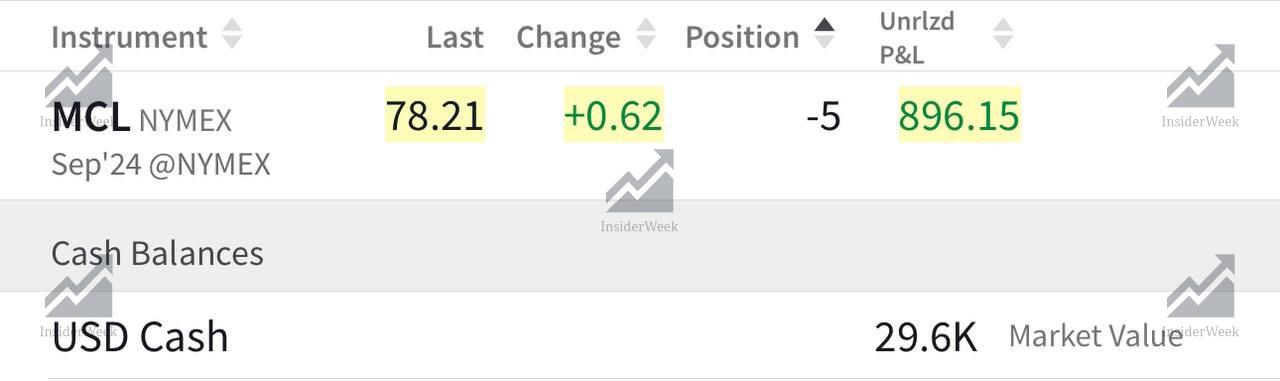
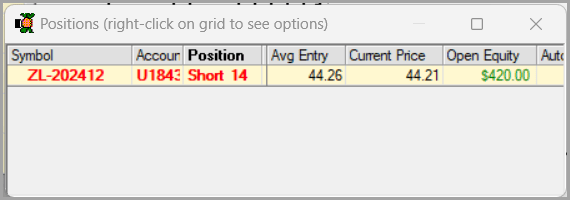
Open positions
COT-1 Account
Jul 25, 202416:03:36 UTC

StartUp Account
Jul 25, 202416:42:08 UTC
COT-2 Account
Jul 25, 202416:03:55 UTC
Most recent trades
Updated on 24 Jul 2024
Download XLS
COT-1 Account
COT-1 Account
Futures
CRUDE OIL
PALLADIUM
LIVE CATTLE
SUGAR
CORN
L/S
long
long
long
long
short
Closed
16 Jul 2024
12 Jul 2024
09 Jul 2024
27 Jun 2024
06 Jun 2024
P/L
-$8,550
$1,550
-$3,780
$5,824
-$1,912
Profit, $
$906,410
$914,960
$913,410
$917,190
$911,366
StartUp Account
Futures
CRUDE OIL e-mini
S&P500 e-micro
SUGAR
AUSTRALIAN $
MEXICAN PESO
L/S
long
long
long
long
long
Closed
16 Jul 2024
01 Jul 2024
27 Jun 2024
30 May 2024
08 Apr 2024
P/L
-$893
-$748
$409
-$141
$1,440
Profit, $
$-1,625
$-732
$16
$-393
$-252
COT-2 Account
Futures
SUGAR
SOYBEAN OIL
S&P500 E-MINI
GOLD
SOYBEAN OIL
L/S
short
short
long
long
long
Closed
24 Jul 2024
23 Jul 2024
18 Jul 2024
17 Jul 2024
15 Jul 2024
P/L
$11,200
-$588
-$3,475
$8,710
-$6,288
Profit, $
$550,421
$539,221
$539,809
$543,284
$534,574
Profit by week, USD
Initial capital $14,000
Initial capital $50,000
Initial capital $100,000
Initial capital $30,000
Initial capital $10,000
P/L per Quarter, USD
Short/long ratio by profit
Profit and losses by week
| Week | P/L | Profit, $ | Draw Down | |
|---|---|---|---|---|
| $ | % | |||
| 2024-30 | $10,612 | 1,493,777 | -62,350 | -3.62 |
| 2024-29 | -$10,496 | 1,483,165 | -72,962 | -4.24 |
| 2024-28 | $20,550 | 1,493,661 | -62,466 | -3.63 |
| 2024-27 | -$8,198 | 1,473,111 | -83,016 | -4.83 |
| 2024-26 | $6,233 | 1,481,309 | -74,818 | -4.35 |
| 2024-25 | -$5,040 | 1,475,076 | -81,051 | -4.71 |
| 2024-24 | $0 | 1,480,116 | -76,011 | -4.42 |
| 2024-23 | -$7,512 | 1,480,116 | -76,011 | -4.42 |
| 2024-22 | -$1,506 | 1,487,628 | -68,499 | -3.98 |
| 2024-21 | $15,000 | 1,489,134 | -66,993 | -3.89 |
| 2024-20 | $8,525 | 1,474,134 | -81,993 | -4.77 |
| 2024-19 | $14,189 | 1,465,609 | -90,518 | -5.26 |
| 2024-18 | $18,445 | 1,451,420 | -104,707 | -6.09 |
| 2024-17 | $250 | 1,432,975 | -123,152 | -7.16 |
| 2024-16 | -$15,582 | 1,432,725 | -123,402 | -7.17 |
| 2024-15 | $6,617 | 1,448,307 | -107,820 | -6.27 |
| 2024-14 | $12,053 | 1,441,690 | -114,437 | -6.65 |
Key metrics
Initial capital $14,000
Initial capital $50,000
Initial capital $100,000
Initial capital $30,000
Initial capital $10,000
Key metrics
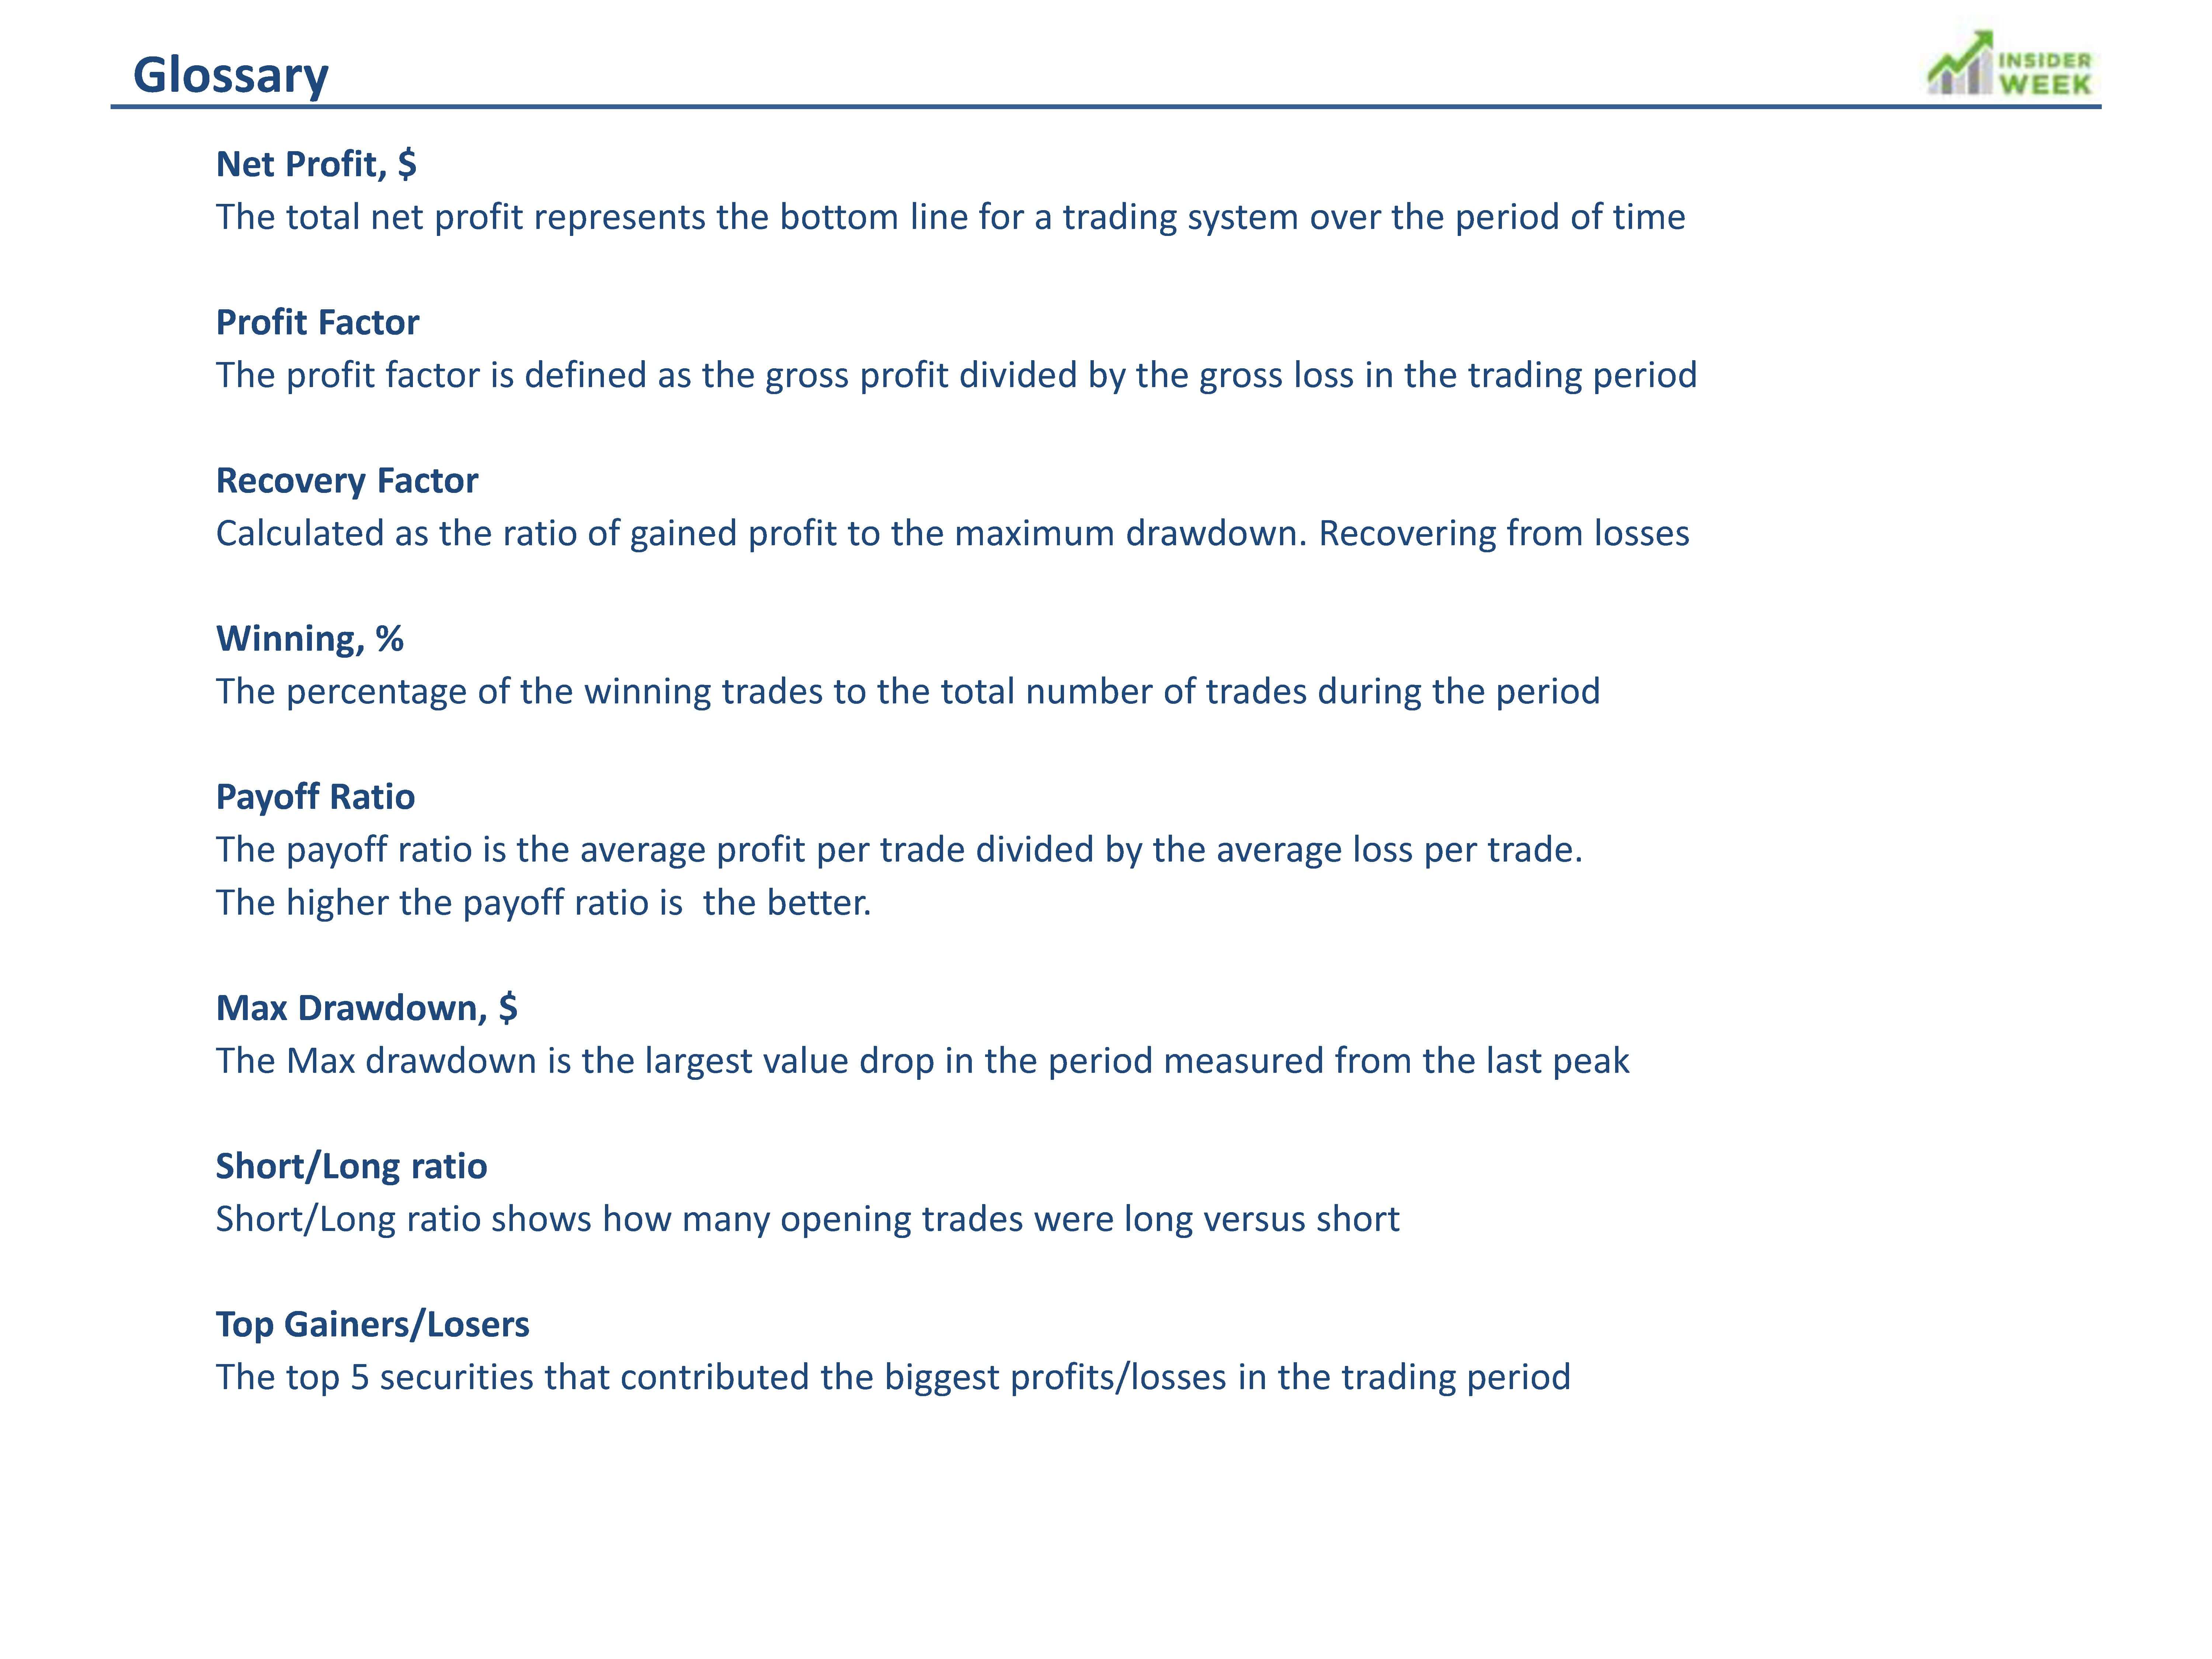
Net Profit, $
Profit Factor
Number of trades, qty
Winning, %
Max Drawdown, $
Max Drawdown, %
2014
$45,805
6.54
32
59%
$2,430
1.28%
2015
$75,466
6.85
36
64%
$2,763
1.13%
2016
$71,297
2.40
79
61%
$7,427
2.14%
2017
$79,251
2.19
138
66%
$14,347
3.95%
2018
$107,537
1.74
123
67%
$22,425
5.08%
2019
$95,814
1.60
109
55%
$27,652
4.92%
2020
$132,180
1.79
92
61%
$45,162
6.19%
2021
$426,486
2.57
153
60%
$40,976
4.75%
2022
$279,366
1.56
201
57%
$46,187
3.77%
2023
$207,425
1.32
215
56%
$174,373
10.48%
2024
$-26,850
0.91
73
38%
$135,637
7.89%
Total
$1,493,777
1.64
1251
59%
$174,373
10.48%
Key metrics
Net Profit, $
Profit Factor
Number of trades, qty
Winning, %
Max Drawdown, $
Max Drawdown, %
2014
$45,805
6.54
32
59%
$2,430
6.01%
2015
$75,466
6.85
36
64%
$2,763
2.95%
2016
$71,297
2.40
79
61%
$7,427
3.77%
2017
$79,251
2.19
138
66%
$14,347
6.72%
2018
$107,537
1.74
123
67%
$22,425
7.69%
2019
$95,814
1.60
109
55%
$27,652
6.72%
2020
$107,403
1.67
74
59%
$45,162
7.79%
2021
$101,500
1.59
60
57%
$77,473
12.25%
2022
$150,410
1.90
55
65%
$49,619
7.09%
2023
$179,266
1.68
80
64%
$63,975
7%
2024
$-107,339
0.51
30
33%
$128,513
12.35%
Total
$906,410
1.64
816
61%
$128,513
12.35%
Key metrics
Net Profit, $
Profit Factor
Number of trades, qty
Winning, %
Max Drawdown, $
Max Drawdown, %
2014
-
-
-
-
-
-
2015
-
-
-
-
-
-
2016
-
-
-
-
-
-
2017
-
-
-
-
-
-
2018
-
-
-
-
-
-
2019
-
-
-
-
-
-
2020
$24,777
4.18
18
67%
$3,370
4.31%
2021
$293,269
4.10
88
63%
$11,687
4.54%
2022
$73,153
1.25
104
52%
$54,331
12.57%
2023
$73,843
1.22
111
52%
$141,791
23.13%
2024
$85,379
2.06
31
52%
$109,335
17.84%
Total
$550,421
1.69
352
55%
$141,791
23.13%
Key metrics
Net Profit, $
Profit Factor
Number of trades, qty
Winning, %
Max Drawdown, $
Max Drawdown, %
2014
-
-
-
-
-
-
2015
-
-
-
-
-
-
2016
-
-
-
-
-
-
2017
-
-
-
-
-
-
2018
-
-
-
-
-
-
2019
-
-
-
-
-
-
2020
-
-
-
-
-
-
2021
$31,717
6.54
5
60%
$3,660
2.7%
2022
$55,803
2.33
42
60%
$18,475
9.29%
2023
$-48,949
-
2
50%
$60,364
30.34%
2024
-
-
-
-
-
-
Total
$38,571
1.40
49
59%
$60,364
30.34%
Key metrics
Net Profit, $
Profit Factor
Number of trades, qty
Winning, %
Max Drawdown, $
Max Drawdown, %
2023
3,265
1.65
22
50%
1,736
5.79
Jan
-
-
-
-
-
-
Feb
-1,539
-
3
-
1,539
4.63%
Mar
-2,571
-
3
-
4,110
12.36%
Apr
593
1.70
2
50%
4,957
14.9%
May
-141
-
1
-
3,658
11%
Jun
409
-
1
100%
3,249
9.77%
Jul
-1,641
-
2
-
4,890
14.7%
Aug
-
-
-
-
-
-
Sep
-
-
-
-
-
-
Oct
-
-
-
-
-
-
Nov
-
-
-
-
-
-
Dec
-
-
-
-
-
-
Total
$-1,625
0.86
34
38%
$4,957
14.9%
Key metrics
Net Profit, $
Profit Factor
Number of trades, qty
Winning, %
Max Drawdown, $
Max Drawdown, %
2014
-
-
-
-
-
-
2015
-
-
-
-
-
-
2016
-
-
-
-
-
-
2017
-
-
-
-
-
-
2018
$1,449
1.38
15
47%
$2,074
16.53%
2019
$6,124
2.88
27
59%
$1,207
7.6%
2020
$2,798
2.38
15
67%
$1,118
5.51%
2021
-
-
-
-
-
-
2022
-
-
-
-
-
-
2023
-
-
-
-
-
-
2024
-
-
-
-
-
-
Total
$10,371
2.14
57
58%
$2,074
16.53%
Max posts a new trading result video each Sunday for the past week’s trading. You can scroll through past weekly results.
My hope is that by posting my actual trading performance, you will be able to share in my success. I hope you will come trade with me.