What is Open Interest? With examples from futures trading
Are you wondering what open interest is and whether it is important to consider it? When futures traders plan their trading and weigh their decisions, they also consider open interest.
Open Interest Definition
Open interest (OI) is a characteristic ratio that exists only in the options and futures markets.
It describes the amount of all open futures contracts and options of a market at the end of a trading day. It is therefore the total number of all contracts that have not been closed out by an offsetting transaction or that have been settled by physical delivery or cash settlement.
Open interest is calculated and published by the respective exchange at the close of trading. It is one of the key indicators of a market's liquidity.
Important to know: in the futures market there are always two parties trading with each other. One trader sells a contract (short position) and another one buys it (long position). There is now exactly one contract in the market, the open interest is 1.
In the stock or bond markets, there is no open interest. If you read the term in the context of stocks or even FOREX, it is a misuse of the term. Do not fall for it.
Futures and Open Interest
Simply put, open interest increases by 1 when a new contract is created and it decreases by 1 when an existing contract is terminated (closed out).
What does this mean?
A new contract is created when a new participant enters the market and buys or sells a contract short for the first time. (The actual number of all contracts on the futures markets is not limited - unlike, for example, on the stock market, where a company issues a precisely defined number of shares. This is due to the structure of the futures markets).
Open interest remains unchanged when a position is closed out and a new position of the same size is opened simultaneously. This is a simple transfer of contracts from one person to another.
The open interest decreases when a transaction closes a position for both the buyer and the seller.
Simplified example for calculation - the open interest on the market has the value 100 at the market opening:
The open interest is published daily by the stock exchanges on their websites or in periodic publications. Also various market newsletters contain this information.
At InsiderWeek, we obtain the values directly from the Commitment of Traders - Report of the CFTC (Commodity Futures Trading Commission), the supervisory authority of the US futures exchanges:
.png)
Fig. 1: Excerpt from the COT report of Friday, 10/21/2022.
Explanations:
- The "Total" value of the "Reportables" is the sum of the long positions of the Commercials, the Non-Commercials PLUS the spread positions of the Non-Commercials. These numbers are reported to the CFTC by the brokers/clearing houses.
- The total open interest is determined by the exchange (CBOT in this case) at the close of trading and reported to the CFTC.
- The positions of the "non-reportables" are calculated as the difference between Total OI MINUS Total of the reportables.
The same calculation can be made taking into account short positions PLUS the spreads of the non-commercials.
Open Interest and Options
Apart from futures trading, open interest is also used in options trading. Here it has the same meaning: it expresses the number of all subscribed options. In the futures market, one long position is matched by exactly one short position. We find the same in options trading:
If you buy 10 Call Options, you buy them to open a position. (In the stock market, each call represents 100 shares, for a total of 1,000 shares). This purchase increases the open interest by 10. When you exit the position, you sell the same call options. The open interest decreases again by 10.
Selling an option can also increase the open interest. For example, if you own 1000 shares and want to open a covered call. For the covered call you sell 10 call options. This means you want to open a short position and therefore the open interest increases by 10. If later on you close this call, the open interest decreases again by 10.
Open Interest vs Price
From time to time, the statement appears in some publications that the open interest provides information about the price development of a financial instrument.
This statement is wrong! The open interest cannot give any information about the further development of the underlying commodity. Look at the following chart. The wheat future December 2022 (ZWZ22) over the time span of the year, in addition volume (bar chart) and open interest (violet line).
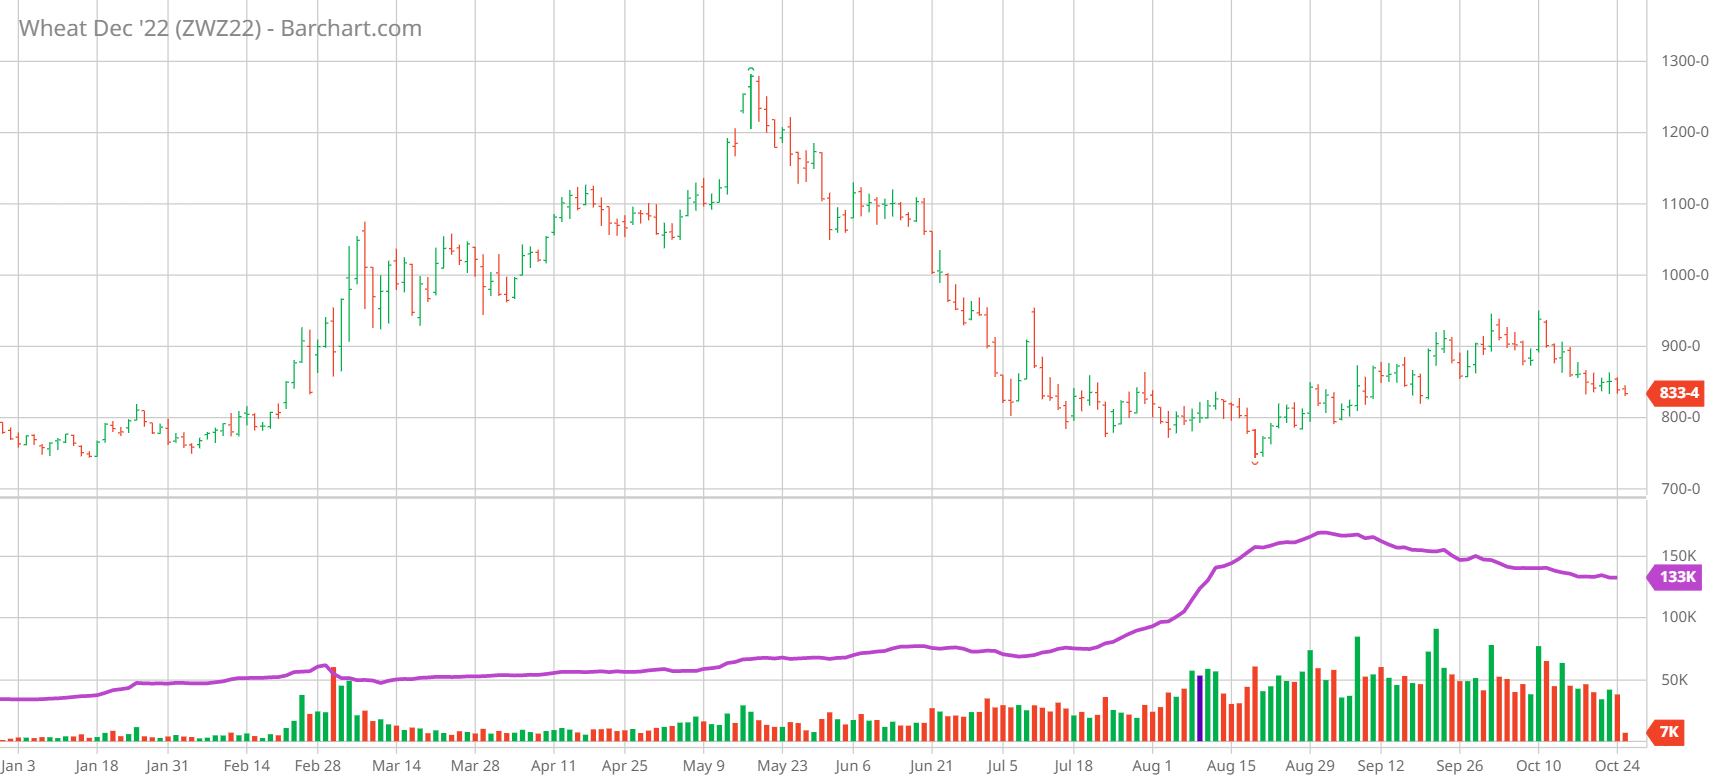
Fig. 2: The ZWZ22 future, daily chart 2022, with volume and open interest.
You see:
The volume and open interest reach a first peak at the end of February. A political event is responsible for this: the invasion of Ukraine by Russian forces. As a result of this event, the wheat price explodes, as supply fears send the markets into turmoil.
The price development is therefore not a consequence of increased trading activity, but rather the opposite: speculators expected a decline in supply on the world market and thus a price increase. So more traders entered the market because the price rose. The price did not rise because there was more action.
Further down the line, volume also quickly levels off, with open interest remaining largely constant over the upcoming 5-month period (with a slight increase in May/June).
In the meantime, the wheat price marks a long-term high and falls back to levels it held before the outbreak of the Ukraine conflict. This development could also not be read from the movement of the open interest.
From August on, volume and open interest grow strongly. The futures price trended sideways at the same level it had at the beginning of the year. And a slight price increase in September is even accompanied by a falling open interest.
This example clearly shows:
Open interest is not suitable for deducting a price forecast. Future price developments cannot be derived from the number of open contracts, as each measure includes both a long and a short position. A high value is merely an indication of increased activity in the market.
Yet another example of a very volatile market: the December22 bitcoin future (BTZ22), daily chart over the 3-year period.
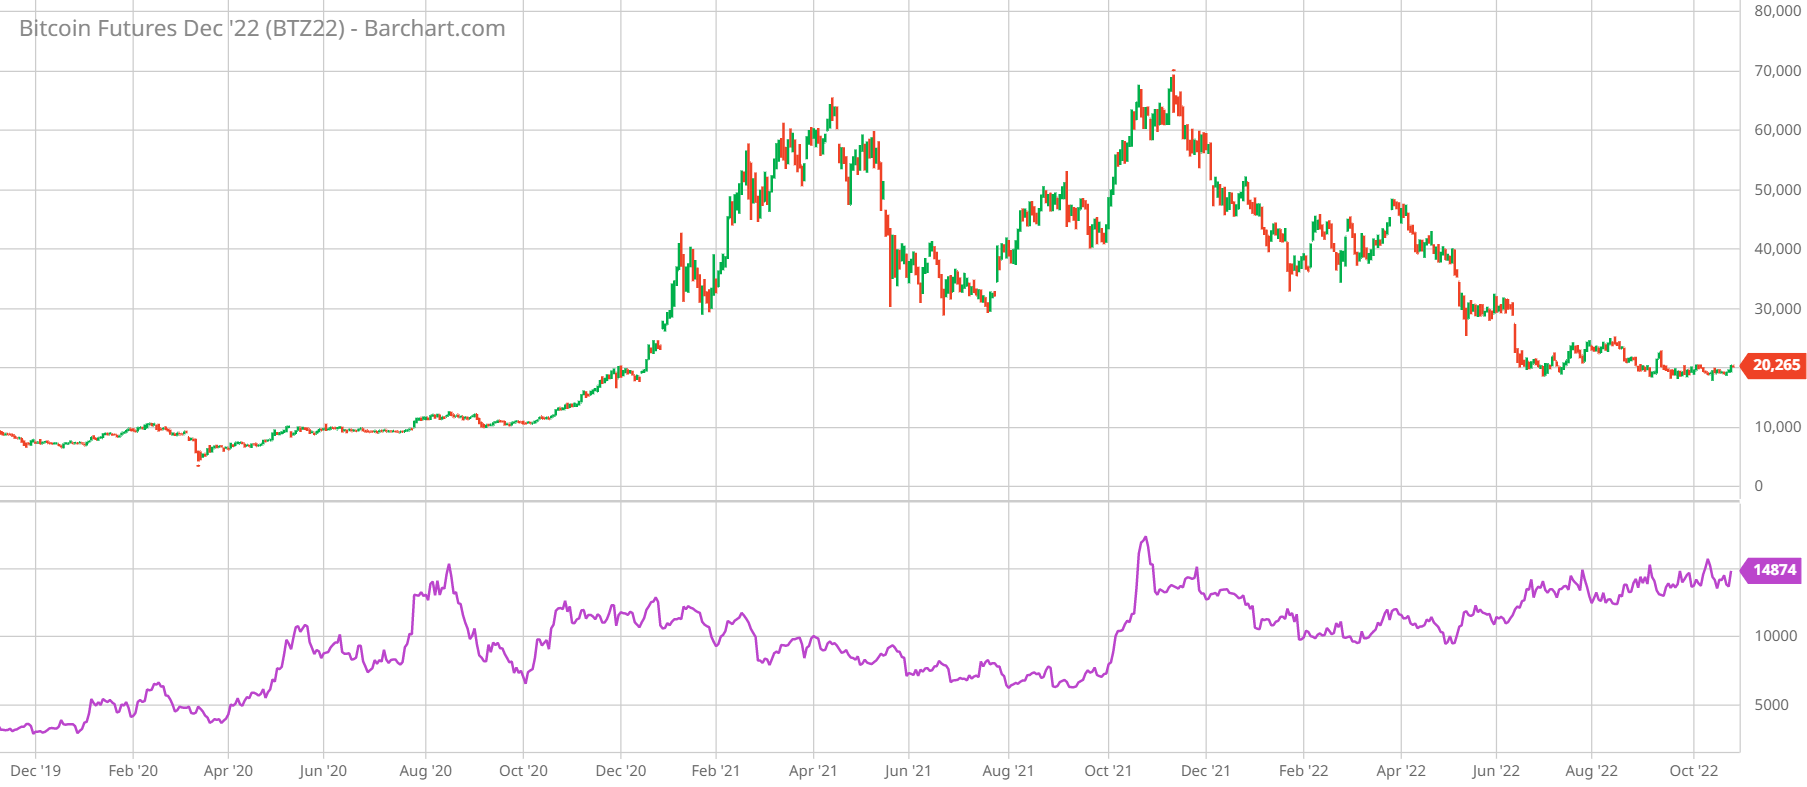
Fig. 3: The Future BTZ22, daily chart 2019-22, with open interest.
Here, the open interest fluctuates much more than in the previous example. But again, you can see: there is no direct correlation between the price of the coin and the open interest.
Nevertheless, there is an interesting spot in Q4 2021. A strong price increase is accompanied by a simultaneous explosion of the open interest.
The driving force behind the coin's price run was Elon Musk, who declared in July that Tesla was accepting bitcoin as payment again (after not accepting bitcoin in May - see the coin's price drop).
As a result, the BTC price rose again. When it hit a new high in September, buyers rushed into the market and open interest went up, in parallel with the price.
This euphoria culminated in an all-time high for bitcoin in November. As a result, traders withdrew from the market. However, even in this market, the open interest cannot be used as a reliable indicator for the price development of the underlying financial instrument.
Open Interest vs Volume
Volume and open interest are not the same. The two concepts are related, but volume measures the number of all completed trades, i.e. all purchases and sales during the day. It is thus a value that increases continuously throughout the day as stock market activity occurs.
Open interest, on the other hand, shows the number of all contracts that are outstanding, i.e. "actively traded", at the end of the day. It is updated only once a day, usually at the close of the exchange.
The following chart illustrates volume and open interest on the CME (Chicago Mercantile Exchange). Note here:
Bar '17th OCT' (far right): Although the exchange (floor trading) has not yet opened, trading (→ volume) is already taking place. The marketplace is the CME Globex electronic trading system.
The green line represents the open interest. It tentatively ends on Friday, Oct. 14.
Take a closer look at the curve of the green OI line: the open interest always grows from Monday to Thursday, on Friday (red arrows) it stagnates or falls. This shows a typical behavior of many market participants: The reason is that many traders close out their positions on Friday to avoid the risk of a gap at the market opening on Monday. For the same reason, traders in some markets avoid opening new positions on Fridays.
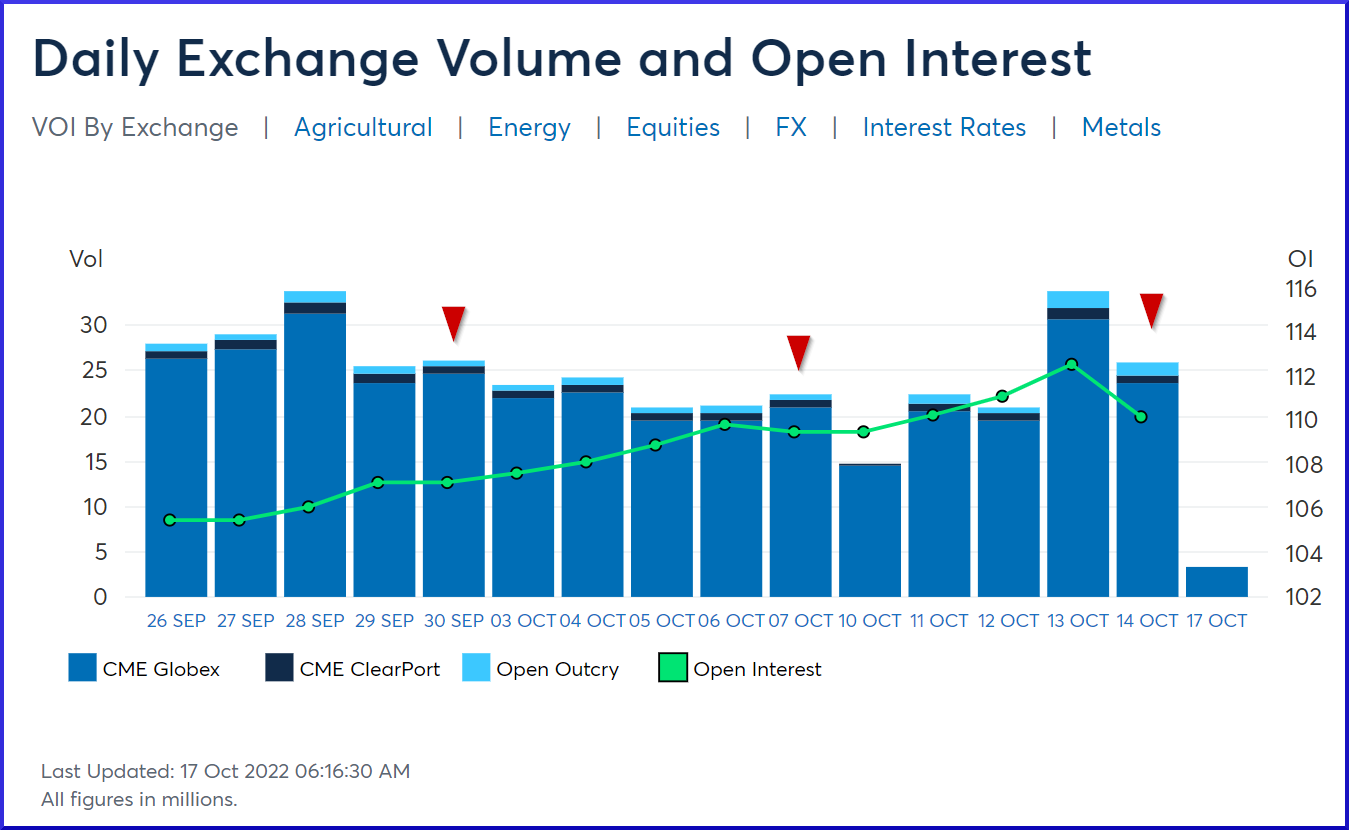
Fig. 4: Volume and open interest on the CME. The chart was retrieved on 10/17/2022, 1:16:30 PM (6:16:30 Chicago time). Fridays are marked with ▼.
Practice: Futures Open Interest
Open interest provides information on whether money is flowing into or out of a market. It is therefore used to estimate market activity.
Active, liquid markets have a higher open interest than less liquid ones. This helps you evaluate correlated markets.
To do this, you need to look at the trend over time. Rising values signal an inflow of financial resources. Falling values, on the other hand, suggest that money is being taken out of the market.
Example:

Fig. 5: Crude Oil Future Dec. 22(CLZ22) and the Future RBOB Gasoline Dec. 22 (RBZ22).
The Crude Oil Future Dec.22 (CLZ22) and the Future RBOB Gasoline Dec.22 (RBZ22) show a correlating course. When looking at the open interest, it is noticeable that the Crude Oil Future at the end of May with 247,000 open contracts shows almost 8 times the open interest as the Gasoline Future, i.e. significantly more "action".
However, it is also noticeable that the open interest in the RBOB Gasoline has grown continuously since April, so here in recent weeks more participants enter the market, while in Crude Oil the open interest persists at a high level.
A decision, which of the two contracts is suitable for opening a position, is of course dependent on other factors. In any case, the more liquid one at the moment is Crude Oil.
Within a market, this ratio is also important when it comes to determining liquid futures. If a future is rolled, it is important to recognize which of the subsequent futures offers more prospect of price action.
Here is an example as well.
We own the December contract in Gold (GCZ22), which is to be rolled. When looking at the open interest of the following contracts, we notice that the immediate follow-up contract January 23 has almost no open interest, so we decide to take the next but one contract February 23.
A note: the screenshot comes from the site Barchart.com. Make sure here to set the display to "End Of Day" and "Main View" to show the Open Interest.
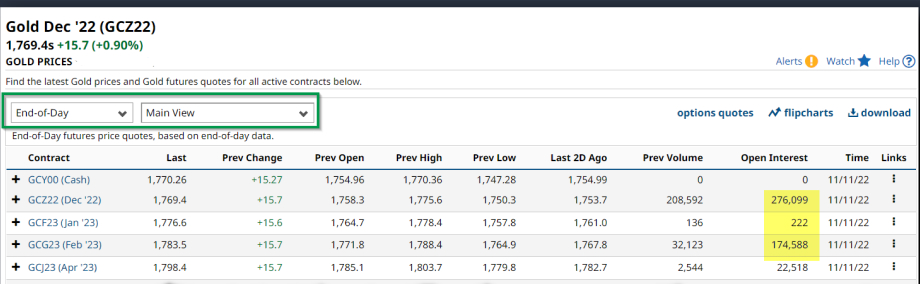
Fig. 6: Gold December (GCZ22)
Summary
- Open Interest is a metric limited to futures and options trading. Other markets such as stock trading do not know this value.
- It is determined by the exchange at the end of each trading day.
- It indicates how many contracts are outstanding at that time, i.e. neither closed out nor fulfilled by delivery or cash settlement.
- Open interest shows how liquid a market is and how actively a commodity is traded.
- It is not suitable for deriving a forecast of the price development of a financial instrument.
Sources:
Fig. 1: https://www.cftc.gov/dea/futures/deacbtsf.htm
Fig. 4: https://www.cmegroup.com/market-data/volume-open-interest/exchange-volume.html
All charts barchart.com
Curious to learn more?
Get your hands on Max Schulz’s book by downloading it today! Free of charge.