Crisis-proof ETF strategy - Surviving a Crash
The ETF-SP500 Strategy
This strategy is easy to implement and has achieved a double-digit return per year since 1998, with only a few trades per year in one of the safest and largest indices in the world. Perfect for those with limited time who want to improve their annual performance.
In the past, the ETF-SP500 Strategy has successfully navigated all crises. The 2008 financial crisis, the 2001 dot-com bubble, and even the recent 2020 coronavirus crisis.
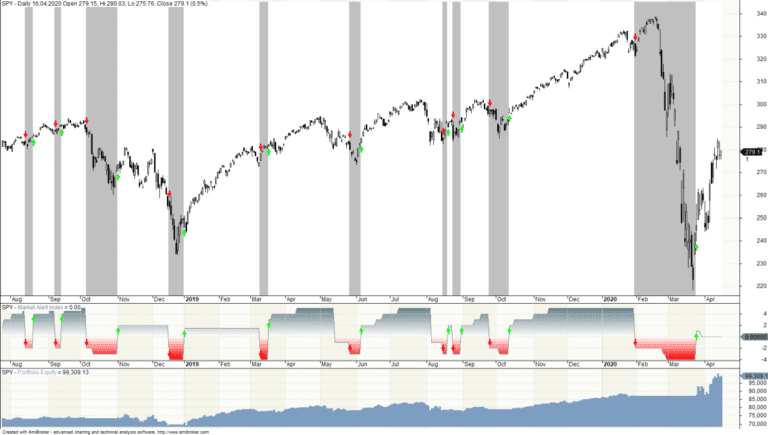
Figure 1: 2020 Coronavirus Crisis
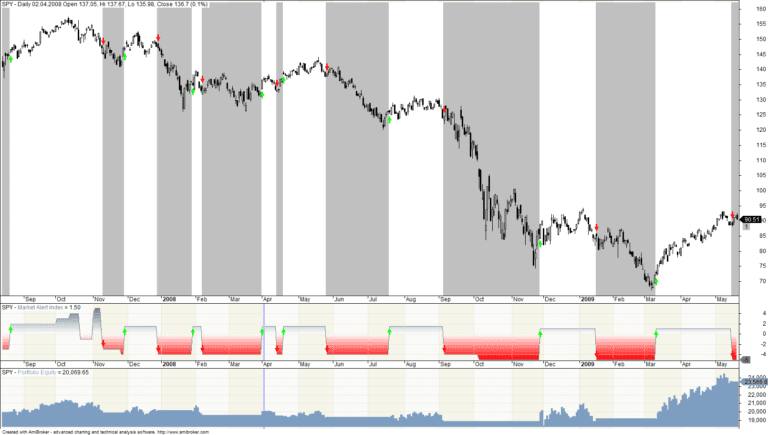
Figure 2: Financial crisis 2008
Where do the entry and exit signals come from?
The strategy is based on the Market Alert Index from W5invest.com. This indicator measures the state of the market using breadth indicators, volatilities, and cross-industry comparisons. It essentially measures the internal strength of the SP500, indicating whether an uptrend is healthy or if a correction can be expected soon.
Being warned of a possible upcoming crash is a great advantage of this strategy, but it can do more. It offers promising entry signals to participate in the next upward movement after a bear market in a timely manner.
The strategy trades only ETFs on the SP500 (SPY or equivalent tradeable counterparts for the European market). This eliminates individual stock risk or the difficult choice of the right stock. There are not many trading signals per year, between 3 and 10. Occasionally, the position size is adjusted.
An email containing the trading instructions is sent a few hours before each trading signal.
An example of a trading instruction:
March 25, 2020
We open a position (ETF on the SP500: SPY, in Europe IE00B5BMR087) at the opening of the market (USA) today.
The investment ratio is 70% (70% of the available capital is invested)
The strategy is comfortable to implement with very few trades per year. Another big advantage is the very high liquidity of ETFs on the SP500. The SP500 itself is the most famous stock index in the world and includes the largest companies in the USA. This eliminates the risk of individual stocks.
The performance of the SP500 ETF strategy speaks for itself:
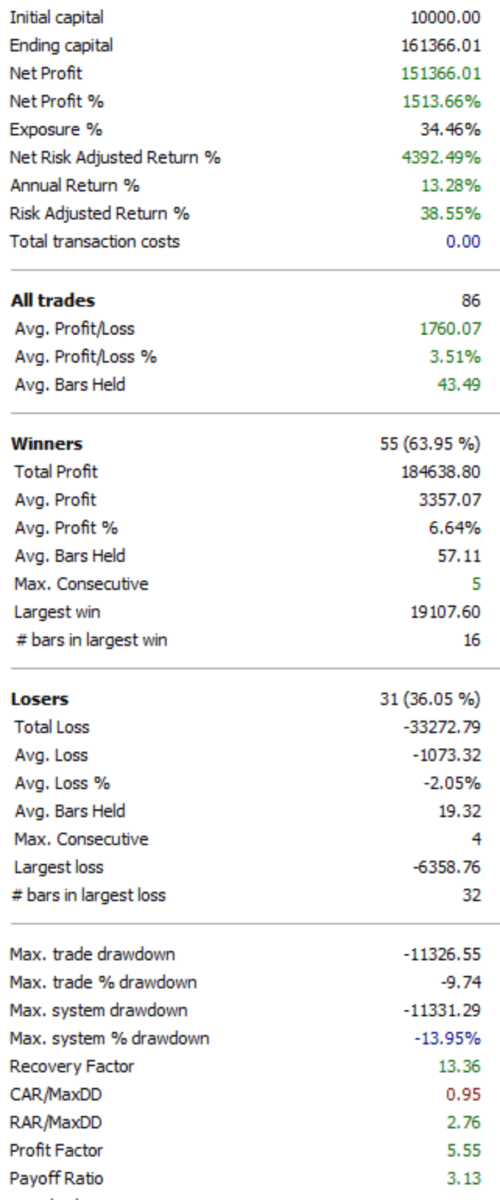
Fig. 3: S&P500 ETF Strategy Metrics

Figure 4: Equity Matrix
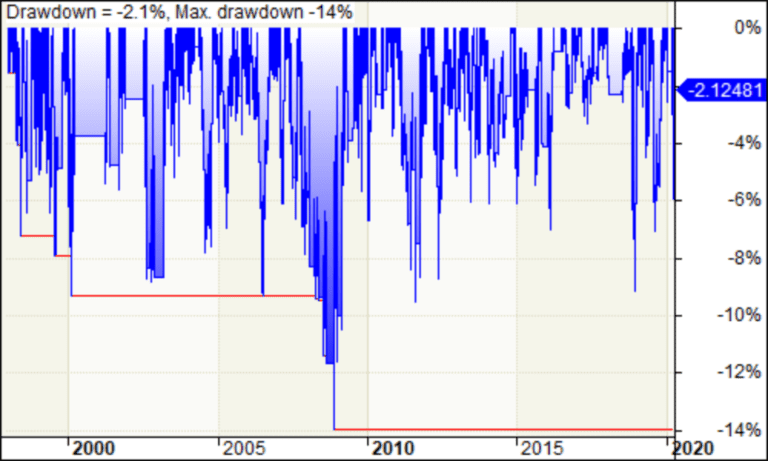
Figure 5: Drawdown of the strategy
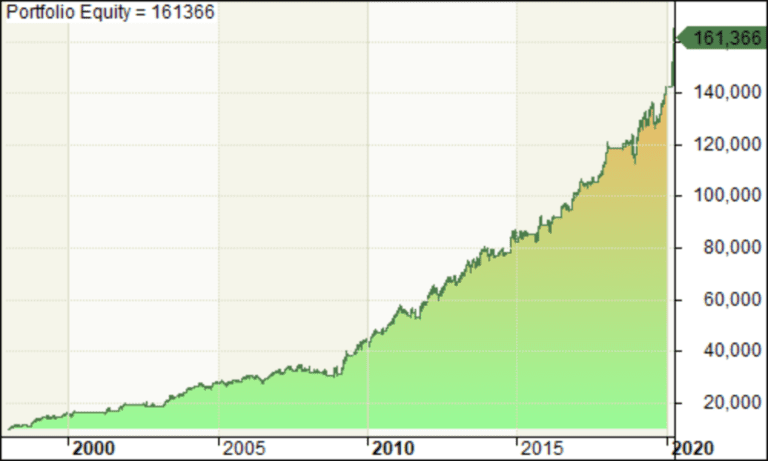
Fig. 6: Equity Curve
With a Cumulative Annual Return of 13% and a maximum drawdown around 10% (only 13% in 2008), this passive strategy yields strong performance numbers. With a leverage of 1.5, we would have an average return of 20% since 1998!
Combination with COT Strategy
This strategy can be perfectly combined with the COT Strategy from InsiderWeek. As seen in the image, despite the improvement in annual performance, the drawdown does not increase!
The correlation of the equity of the two strategies is very low. The image marks exemplary phases, showing that the drawdown phases of both systems do not fall together in time. Ideal for achieving higher returns with less risk.
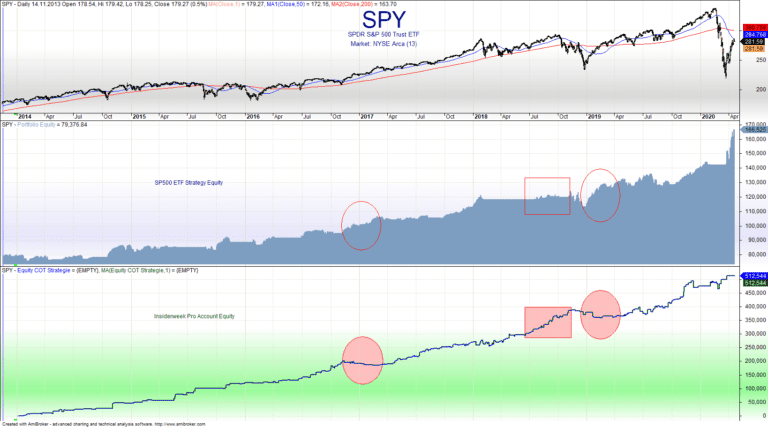
Figure 7: Combination of ETF and COT strategies
Given that the COT strategy leaves 70% of unused capital on the account, the SP500 strategy provides an excellent opportunity for diversification and effectively utilizing the unused capital.
Curious to learn more?
Get your hands on Max Schulz’s book by downloading it today! Free of charge.