COT Report Trading Strategy
What is the COT Strategy about?
This is one of our major strategies that allowed us to increase our trading capital from $ 14.000 to over $ 550.000 within just 6 years. In 2017 we participated in World Cup Championship of Futures Trading® and won the 3rd place by achieving a 111% profit.
You can find an explanation of the COT Trading Strategy in this video.
We believe, the market trends arise from the fundamental market changes and not from the changes on the chart. Accordingly, we build our strategy based on the COT Report that originates from the weekly Commitment of Traders Report. It includes the up-to-date positions of reportable marker players. The goal of the Commitment of Traders Report is to provide transparency in regard to open and outstanding options and future contracts on the market. The data is published each Friday after the close of trading session. In this way, all other market players can understand the positioning of the big trader groups (commercials, large traders and small traders).
We took advantage of this information and evaluated the behavior of these three groups using the COT reports from 1983 to 2013. The analysis showed us how the big players position themselves before rally. This information is the foundation of our trading strategy. We call it COT-signal. Every Sunday we analyse 30 futures markets for such signals.
Figure 1 shows COT-signals for the sugar market. Red arrows show signals for going short (short signal) and green ones for going long (long signal). As you can see on this figure, the COT-signals are very reliable, especially if they match the weekly trend.
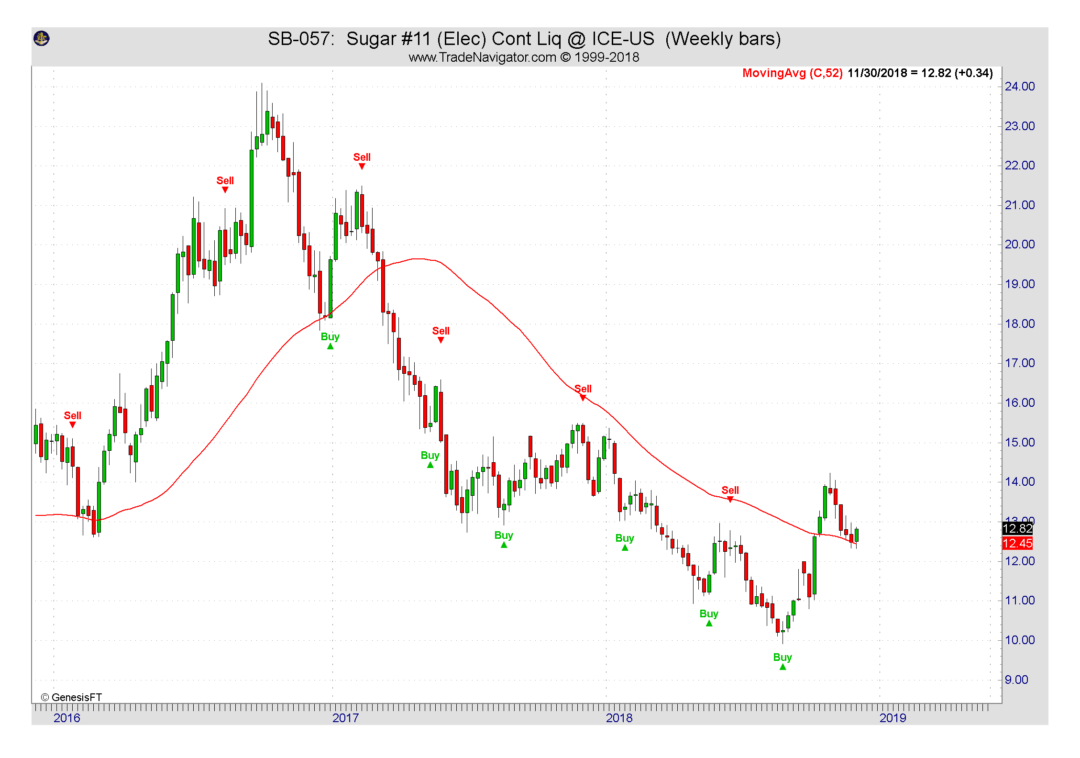
Figure 1. Weekly trend, Sugar
Once a COT-signal is present, we proceed as follows:
Step 1: Weekly Trend.
After getting a COT-signal, we first verify the weekly trend. As already mentioned, signals are more reliable if they match the trend direction.
Step 2: Commercials and Open Interest.
In addition to step one, we take a closer look at the “open interest” and the “commercials” (Figure 2).
- The long signal is provided when “commercials” buy and the “open interest” decreases at the same time.
- The short signal is provided when the “commercials” sell and “open interest” increases at the same time.
Step 3: Sentiment.
COT-signal can be verified by the sentiment that represent the the mood of the public (Figure 3).
- The long signal is provided when the mood of the public is negative (indicator shows a value below 25, green horizontal line).
- The short signal is provided when the mood of the public is positive (indicator shows a value over 75, red horizontal line).
We use software called “Trade Navigator” that indicates two sentiments, the fast and the slow one.
Ideally, both sentiments are in the same positive or negative zone.
Step 4: Seasonal Trend.
This is how an ideal COT-signal looks like (Figure 5). Of course, not every signal is so perfect. However, in order to use a COT-signal, it is sufficient to verify it by just two out of three checks (steps) mentioned above.
It is important to mention that the validity of a COT-signal lasts for approximately 6 weeks. The historical data evaluation confirms that.
Step 5: Timing.
In order to identify the right time for market entry, we analyse the trend of the daily chart. Its highs and lows, as well as the divergence may indicate an upcoming trend change. The divergence can be identified by the RSI indicator. This indicator is regularly a part of almost each standard software.
On the Figure 6 we see that the price reached the new lows even before the COT-signal occurred. However, the RSI indicator did not follow the price and thus, created a price divergence (blue lines). That’s a good indication of an upcoming trend change.
Step 6: Market Entry and Exit.
We start looking for an optimal entry as soon as there are divergences or trend structures that indicate upcoming trend changes. We may use different entry techniques. An effective and simple one is the entry with the trend (see Figure 7). On 24/03/2018 we received a COT-signal. In addition, we identified a divergence between the price and the RSI indicator on the daily chart (see Figure 6).
The price reached a higher high and a highes low. Accordingly, the trend was confirmed by the price breaking the higher high. Simultaneously it identified our point of entry. We placed our stop loss below the low of 2 previous bars. The target was defined as movement between medium term high and low (horizontal blue line in the chart). Based on this analysis and defined strategy, we were able to reach the target and to earn $ 2,500 in profits by risk of $ 500.
We would like to highlight the importance of following scenario: if the price breaks through the lower low (see Figure 7), meaning if the secondary trend continues to sustain, we consider the set up as invalid and wait until the trend changes again. This procedure may sound complicated, but it is very easy to implement. We have a weekly trend (main trend) and a daily trend (secondary trend).
The secondary trend is the correction of the main trend. As soon as the secondary trend turns towards the main trend, we start looking for an entry. If the secondary trend continue to sustain, we do nothing and wait for the next opportunity.
As soon as the entry, exit and risk per trade are defined, we move on to the next step.
Step 7: Risk- and Position-Management
This is one of the most important points that may lead to a success or failure in trading. First, we define the maximum risk per trade. It essentially depends on the risk type of the trader. Generally the total risk should be between 2 and 5% of the investment. We, for example, trade our pro-account with 2% risk per trade. Next, we determine the risk per contract (stop loss). Based on this input, we calculate the size of our positions.
For example, our trading capital amounts $ 200,000 and we are going to take a risk of 2% or $ 4,000 per trade. From the example above, our risk per contract (stop loss) is $ 500. Accordingly, we will trade $ 4,000 / $ 500 = 8 sugar contracts.
The risk money management (RMM) formula can be defined as follows:
(trading capital) x (max risk per trade) / (stop loss) = (position size)
Step 8: Correlation.
If your trading capital has reached a certain size that allows you to trade several markets simultaneously, the correlation between the markets should be taken into account. Ideally, the portfolio should be well diversified. Further information about the correlation of different the markets can be found on the website of the Moore Research Center www.mrci.com or it can be defined by own analysis.
Summing Up, our setup looks as follows:
- COT-signal
- Weekly trend analysis
- COT-signal confirmations by
- Commercials
- Open interest
- Sentiments
- Seasonal trend
- Timing
- Daily trend analysis
- Divergence
- Risk and position management
- Correlation between several setups
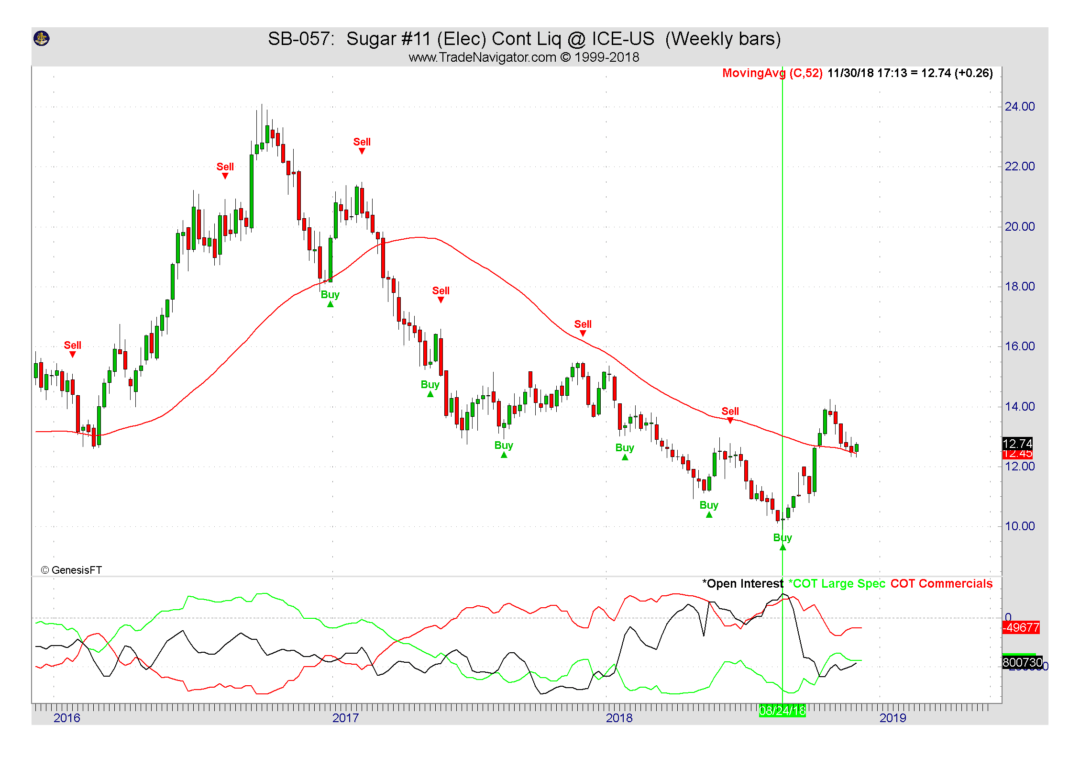
Figure 2. Commercials and Open Interest, Sugar
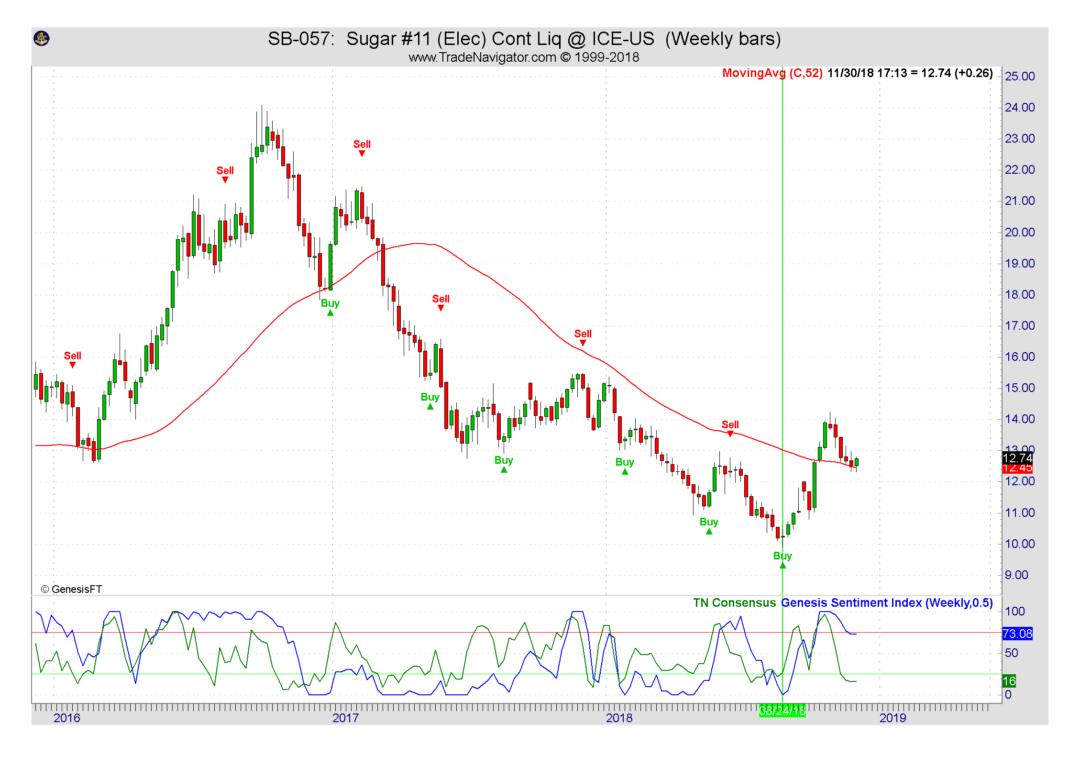
Figure 3. Sentiment, Sugar

Figure 4. Seasonal trend, Sugar
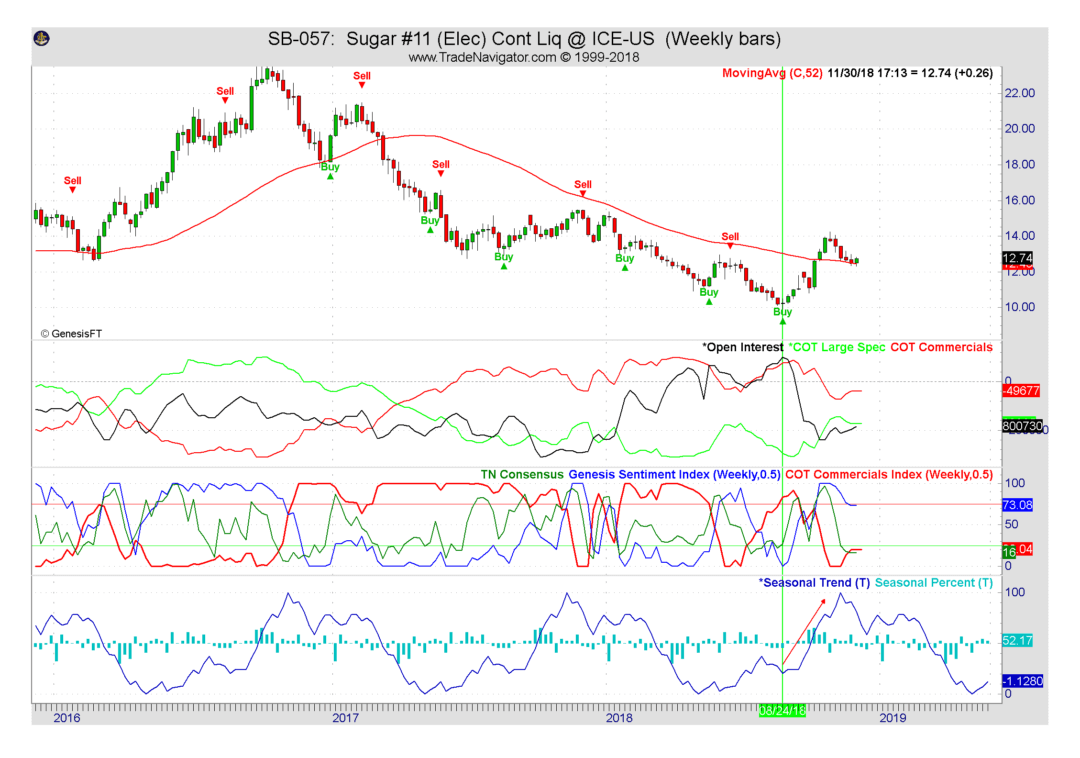
Figure 5. COT-signal, Sugar
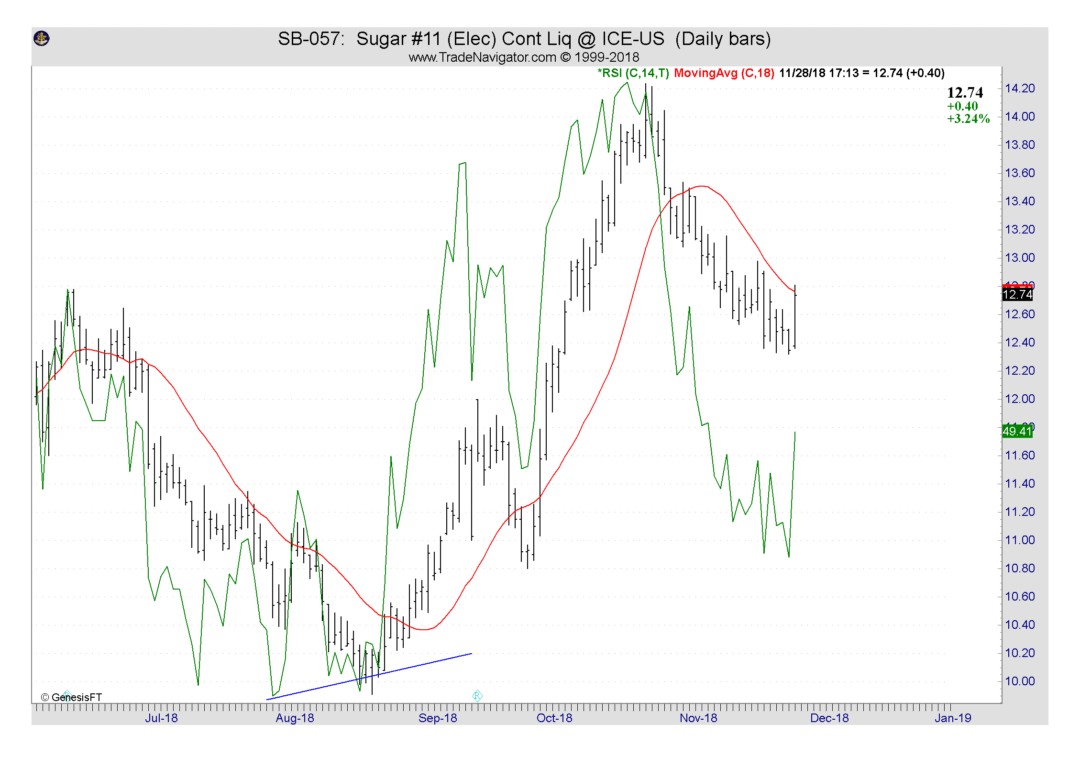
Figure 6. Daily chart, Sugar
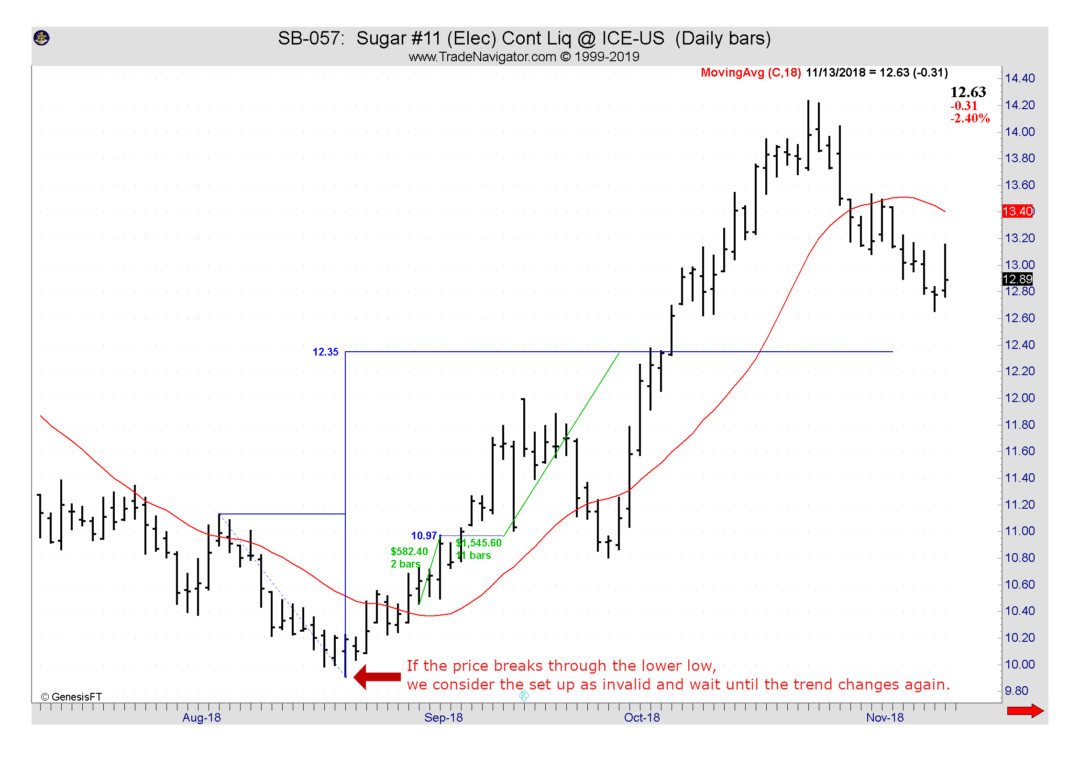
Figure 7. Market Entry and Exit, Sugar
Test your knowledge
Are you eager to learn more about trading?
Book a free consultation with us and we will help you with finding the optimal learning track for you.
Get a free consultation