COT data for gold
In the charts on this page you will find the most important information about the commodity gold for your trading preparation.
In addition to the weekly chart with the price development, you can read the data of the Commitment Of Traders report (COT report). You can see the net positions of the three groups of market participants, the open interest and the COT index, each over the last two calendar years.

Fig. 1: View of the US gold deposit Fort Knox
What is the importance of this data in relation to the raw material gold? How are these values determined and what benefits do we derive from them for our trading? The following post introduces you to the most important facts for this.
What should you know about GOLD?
We have already shown the most important basic information about the raw material gold in another article with a corresponding video. Here are the main points again:
The most important contract specifications can also be read here.
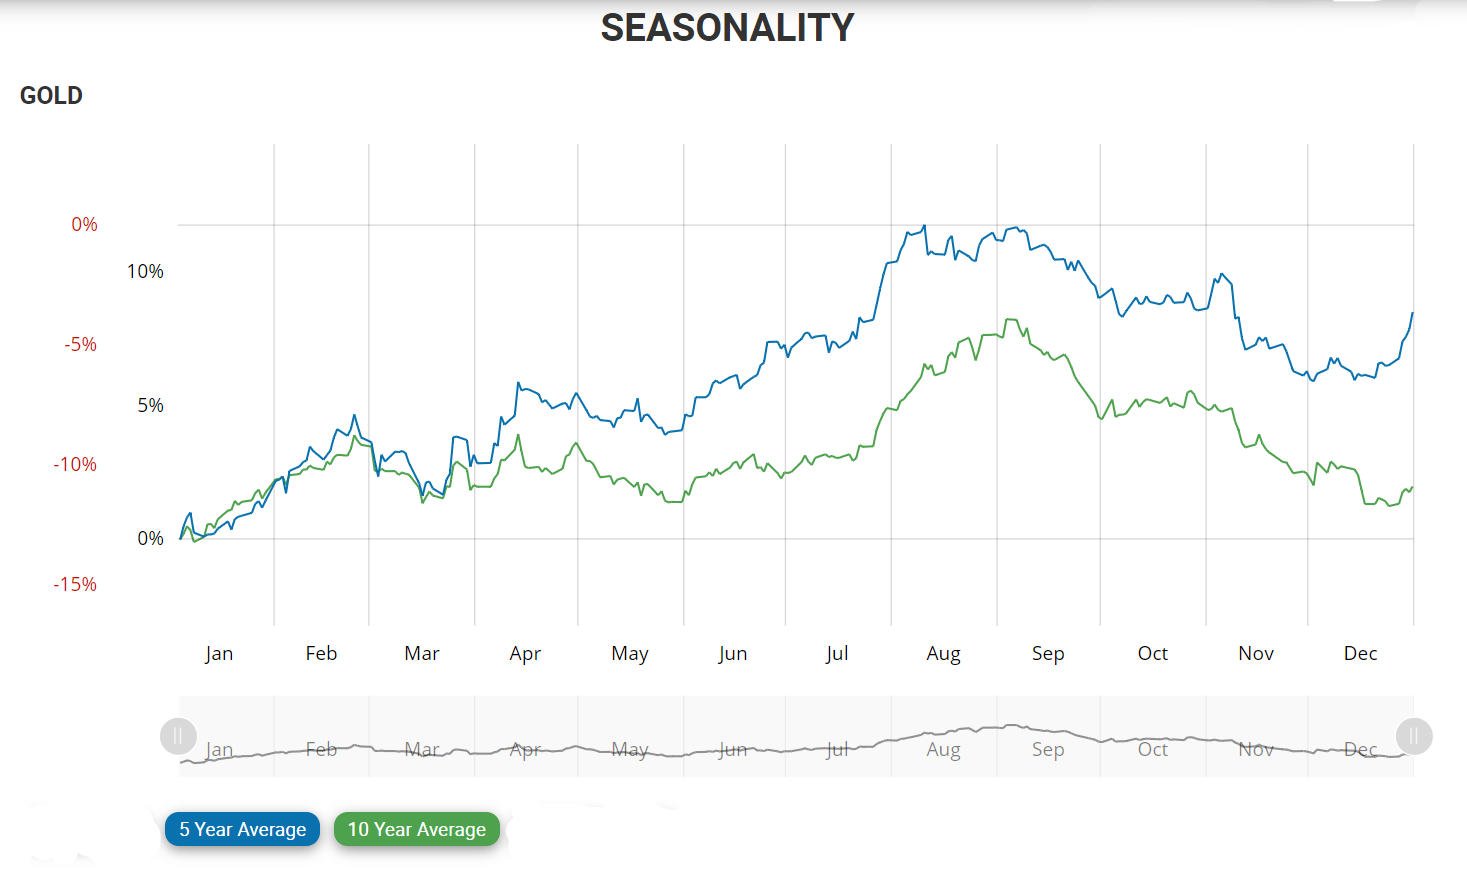
Fig. 2: Seasonal Chart Gold – 5- and 10-years average
The development of the gold price
In the article above, we took a closer look at the factors that determine the gold price. Like all prices on the free market, the price of gold is primarily determined by supply and demand.
Gold is essentially used in two areas of life: around 80% of the gold mined worldwide is used in the jewelry industry for further processing. In addition to its use in the electrical and electronics industry, the precious metal plays an important role in the financial sector: although gold no longer functions as a means of payment, it still fulfils its purpose as an investment and state gold reserve.
However, since the vast majority of gold is processed in the jewelry industry, a seasonal course of the gold price can be determined.
The chart shows the 5-year and 10-year averages of the gold price. The increase of the price up to the middle of the year is striking, with a high in August/September, which can certainly be attributed to the increasing demand in the jewelry industry. After all, almost all cultures celebrate a festival at the end of the year, and give presents to their loved ones.
But let’s now go back to the COT report!
COT Report Gold
The report first reveals to us (box (A)) the long and short positions of the determining market participants. At InsiderWeek, we’re only interested in the commercials.
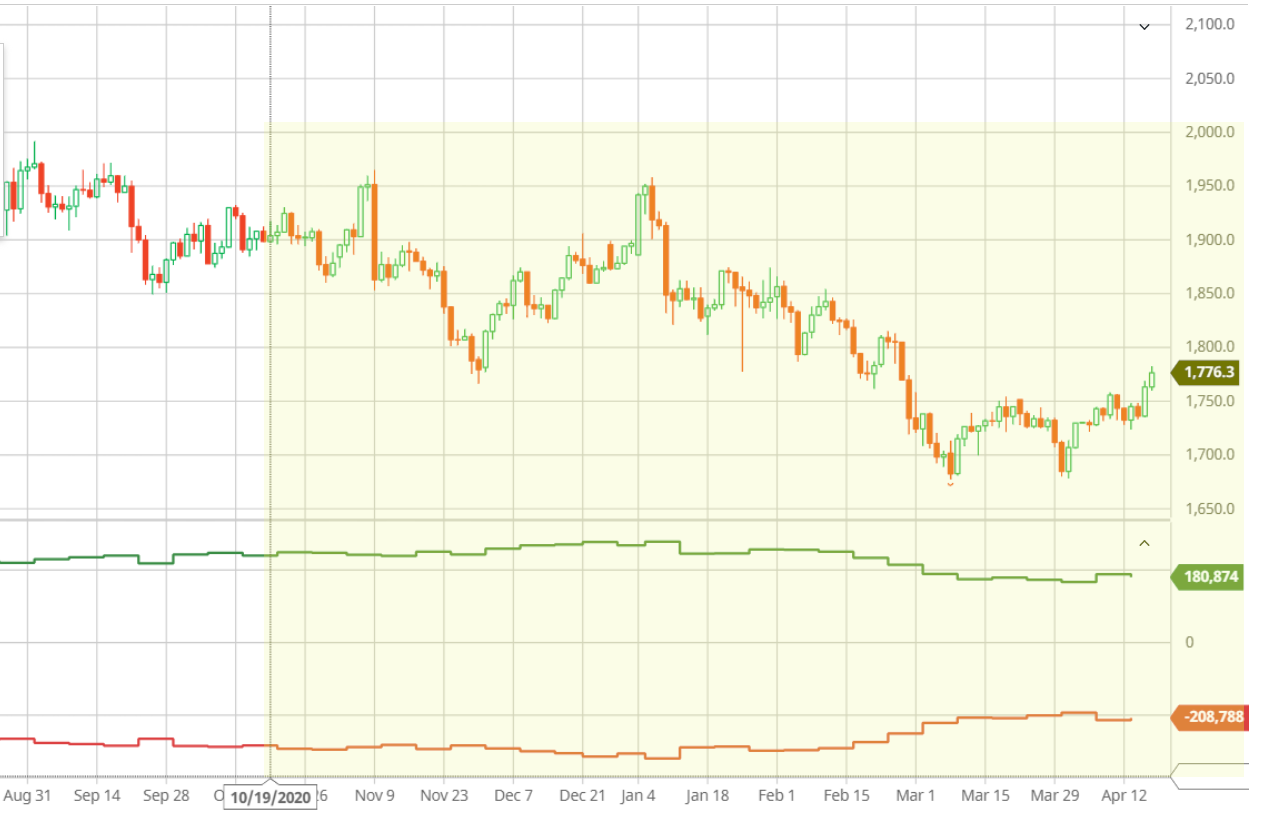
Fig. 3: Gold, Daily Nearby, 26 weeks, net positions Commercials / Large Specs.
THE marketparticipants who are directly involved with the raw material. There are the producers of the raw material on the one hand and the processing companies on the other. They use the futures markets to hedge against price risks or possible delivery failures.
They have their signals for raw materials – and they would be the first to recognize difficulties on the supply side (supply bottlenecks) or on the demand side. You can guess well when the price of the commodity will “run away” in one direction or another and will react accordingly.
Who are these commercials?
In the case of the gold markets, we meet the large producers, i.e. mining companies such as (here the four largest):
- Barrick Gold (203,1 Tonnen) – Kanada
- Newmont Mining (142,7 Tonnen) – USA
- Anglo Gold Ashanti (116,4 Tonnen) – Südafrika
- Newcrest Mining (59,8 Tonnen) – Australien
(in brackets the gold production of 2014 – I’m still looking for more recent figures)
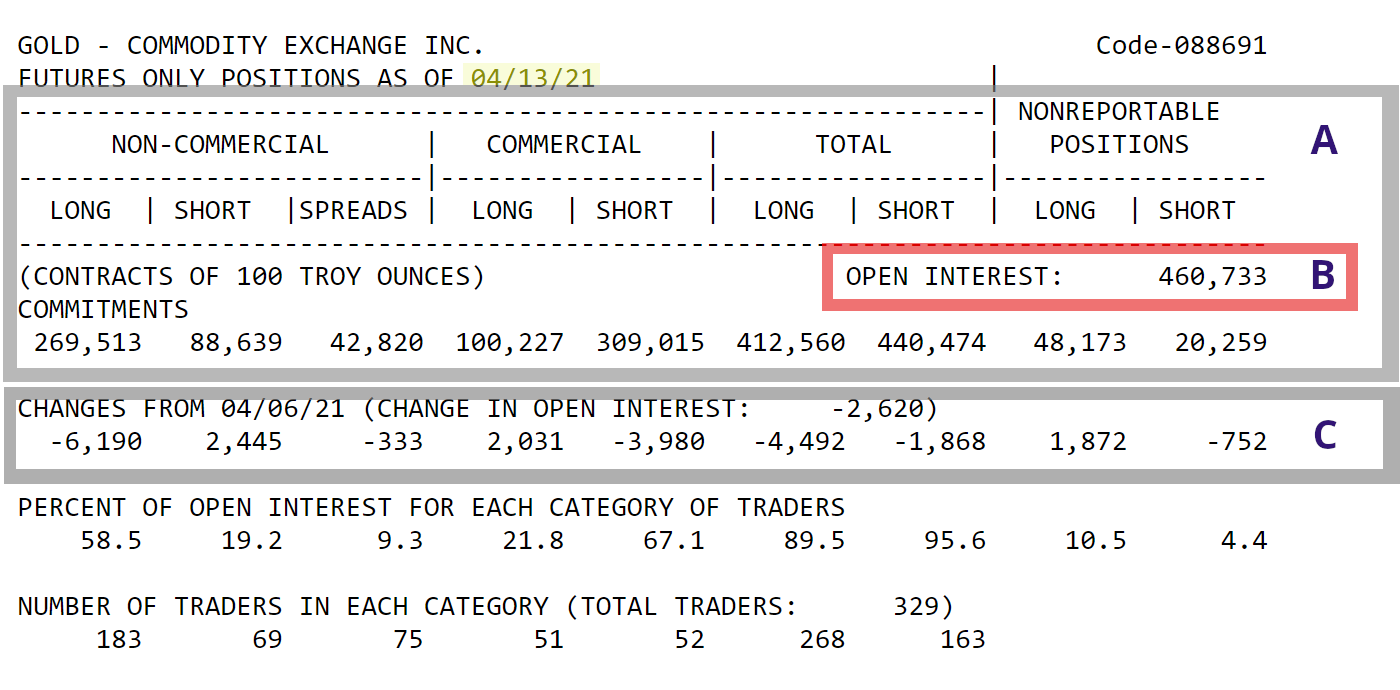
Fig. 4: The COT report for gold from April 13th, 2021
On the opposite side are the big gold dealers such as Bullion Trading LLC or US Mint in the USA as well as international jewellery chains (Christ, Tiffany, Cartier etc.).
In the box below (C) you can see the change in these positions compared to the previous week.
The net positions
The difference between Long positions – short positions we determine the net positions of the participant groups, which are recorded in the second chart.
The open interest
The Open Interest (B), which shows the number of all open contracts at the close of trading on the day in question, is particularly important for these values. The COT report is published by the CFTC on the Friday after the market closes and shows the situation of the previous Tuesday.
The Commercial Index (COT Index)
The fourth and last chart shows the Commercial Index. There is not much point in looking at the current positions of market participants on their own.
Knowing that the commercials in the current week are approx. 208,800 net short contracts – the commercials trade countercyclically and are predominantly net short – says little. We have to see this value in relation to over a longer period of time in order to be able to make a statement about the current situation. To do this, we define the COT index.
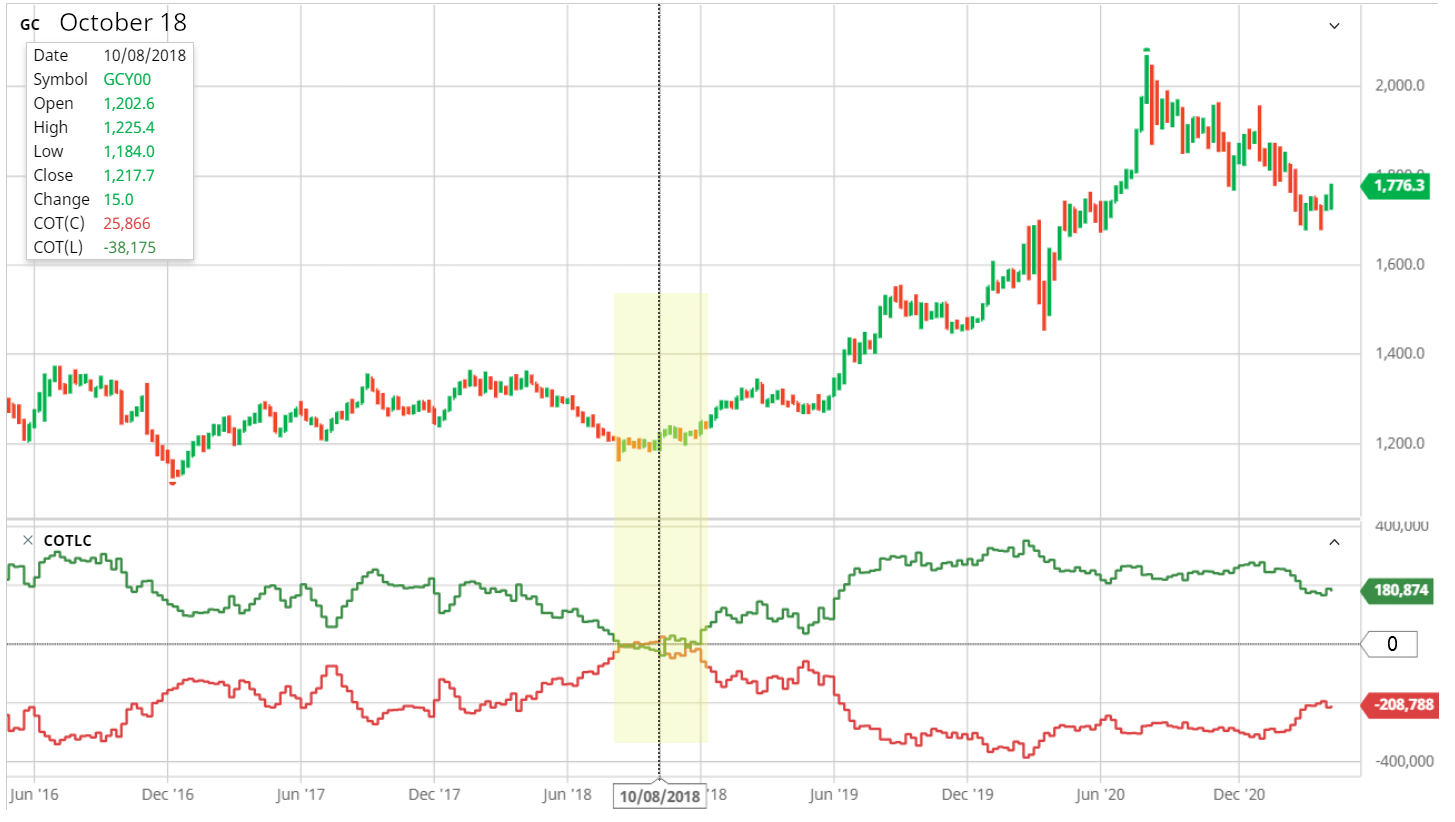
Fig. 5: Gold, Weekly Nearby, 5 years, net positions Commercials / Large Specs.
You can find the formula for this on the previous (table) page. At InsiderWeek, however, we do NOT consider the period of three years to determine the COT index, as was used in the original calculation. We use a period of 26 weeks.
If we look at this period, we see the following values:
- Maximum net position: 320,923 contracts net short (05/01/2021)
- Minimum net position: 193,726 contracts net short (03/30/2021)
With the current net position of 208,788 contracts net short, the formula on the previous page gives a COT – index of 88%
What does that mean?
The COT index is a trigger that indicates overbought or oversold markets. A trend change can be expected shortly in these markets. If the value is above 80 percent, this indicates that the market is becoming more bullish; if it is below 20 percent, then it is very likely that it will become more bearish.
A look into the past
Finally, we will take another look at the gold price in the past and demonstrate the informative value of the COT data.
① Example 1
Since mid-2016, the gold price has varied been between $ 1,200 and $ 1,400 per troy ounce. It briefly broke through this range at the turn of the year 2016/17 and then moved sideways again until the end of 2018.
The commercials were net short the whole time – even if there were interesting constellations in the meantime. This is what I want to draw your attention to:
From around February 2018 the commercials started reducing their net positions and by September they were stable. Finally, October 10, the commercials were almost 26,000 contracts long, a position they had not held since May 2001.
This October 2018 also heralded a rally, which ultimately culminated in an all-time high on August 7, 2020 at $ 2,089 per a troy ounce.
② Example 2
March 11, 2020, the WHO declared Covid19 a global pandemic (arrow in the chart). Gold has been in an upward trend since 2018 (see example 1). The course had changed in February / March – with significant drops.
Starting from their high in October/November 2018, the commercials had almost consistently built up short positions. On February 17, they reached their all-time low with 385,612 net short contracts. Although the gold price rally appeared to be continuing at the time, the commercials apparently suspected otherwise.
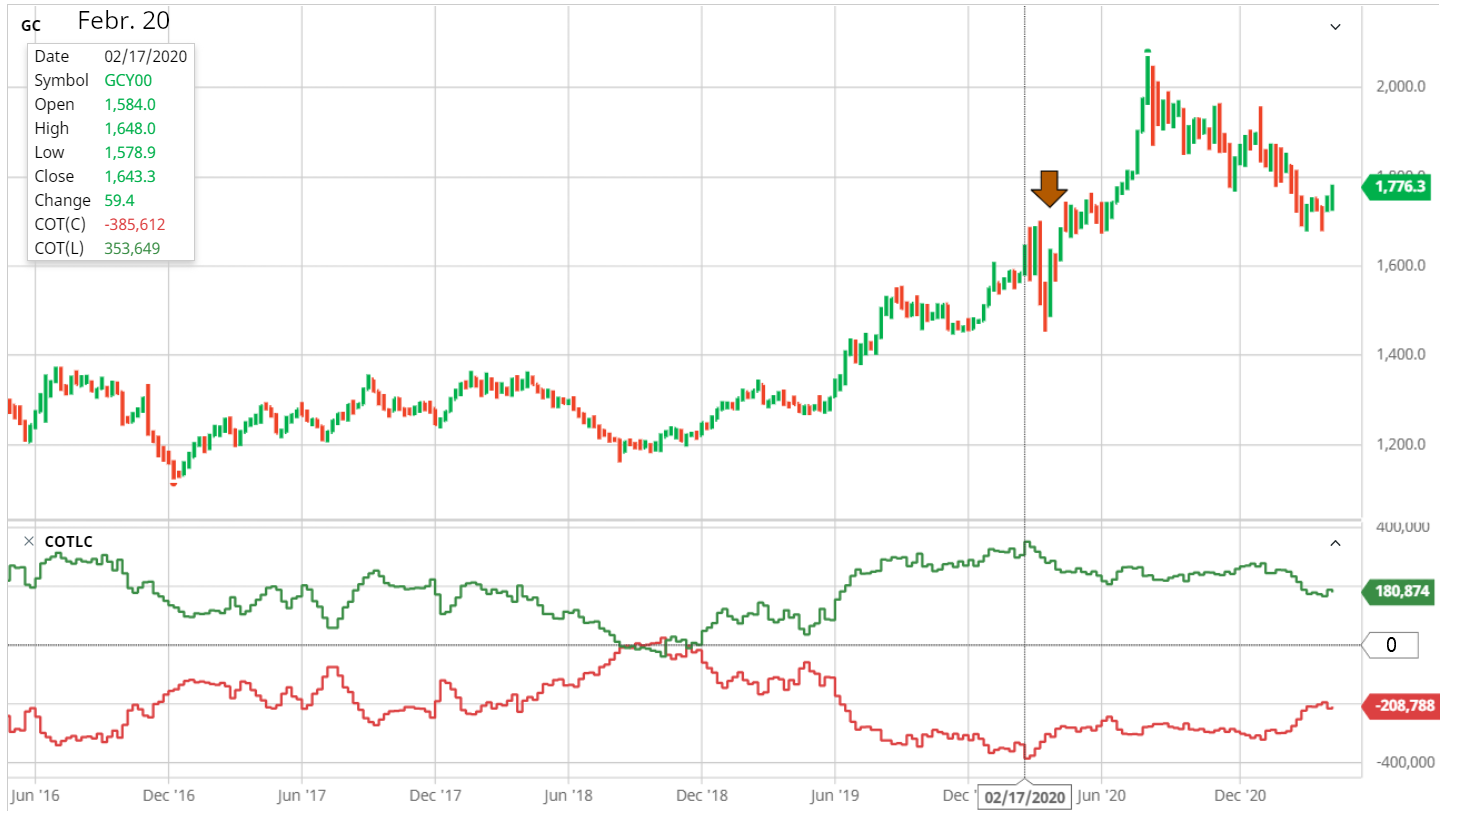
Fig. 6: Gold, Weekly Nearby, 5 years, net positions Commercials / Large Specs.
After the short but severe slump, things went up again. The subsequent new highs in the precious metal – towards an all-time high – can be explained by the fact that gold has always been a popular means of protection in times of crisis – a so-called lifeboat in a crisis. And the commercials also reduced their strong short positions.
In the downtrend of the following weeks, the commercials are significantly reducing their short positions again, which now gives hope for a change in trend.
COT report: the basis for further analysis
The COT report is NOT a timing tool. It shows us markets in which the trend remains stable OR a trend change might occur. However, it does not give us any clear information about WHEN to enter the market.
Would you like to learn about our trading from us?
Then become a member of our practice trading group!
Learn more