How to use the InsiderWeek Commodities Map for trading
What is the InsiderWeek Commodities Map?
Our Commodities Map is a tool designed to help you plan and prepare for your commodities and futures trading activities.
The Commodity Map helps you trade through two key features:
- Select a commodity from the left drop-down menu, it displays the major producing regions for that product.
- Select a country from the right drop-down menu, it provides more detailed information about that country's main resources and commodities.
Why use the Commodities Map?
Warren Buffett, the legendary investor, once said:
Invest only in what you really understand.
Focus your trading efforts on markets where you have a clear understanding of the critical factors that affect the availability and pricing of commodities. These factors will allow you to better assess opportunities and risks. Only with this understanding can you make informed decisions and profit.
The price of any commodity on the market is determined by the dynamic relationship between supply and demand. Most commodities are subject to cyclical fluctuations in both supply and demand.
Demand for agricultural products tends to be relatively stable over long periods of time. For example, it tends to increase, rather than decrease significantly, due to population growth or changes in dietary preferences.
In this context, supply becomes the critical price-determining factor. Several elements influence supply, including:
- The seasonal cycles of planting, growing, and harvesting.
- Climatic and weather-related factors that can affect both the quantity and quality of crops.
- Geopolitical factors such as foreign policy, conflict, or war that can disrupt production.
- Domestic political issues, such as internal tensions or revolutions, that can affect agricultural stability.
- Political decisions and other government actions, such as export bans, import tariffs, sanctions, or subsidies.
But how can our Commodity Map help you make better trading decisions based on these influencing factors? Let's look at one example - cocoa.
The commodity map shows that cocoa cultivation is concentrated in three main regions: South America (especially Brazil), West Africa, and India/Indonesia.
By staying informed about prolonged droughts in Brazil or armed conflicts in West Africa, you will be better equipped to interpret price increases in cocoa futures. With this knowledge, you can make more informed trading decisions based on real-time supply developments.
A practical example of InsiderWeek's daily trading routine
We use the Commodity Map in combination with important weather reports for specific production regions.
When we receive a report of unusual weather in a particular region, we first check to see if that region is important for growing a particular commodity. Depending on the importance of the region and the weather conditions, we can more effectively manage our trading efforts and associated risks.
Example: drought in Brazil
The map below, provided by NOAA, shows soil moisture anomalies in Brazil. Next to it is a screenshot of our Commodities Map, highlighting the main coffee growing areas.
The main coffee growing areas along the coast and in Minas Gerais are experiencing extreme soil dryness, coinciding with the coffee flowering period. As a result, crop expectations are declining and coffee prices are rising. This information is critical to our trading decisions.
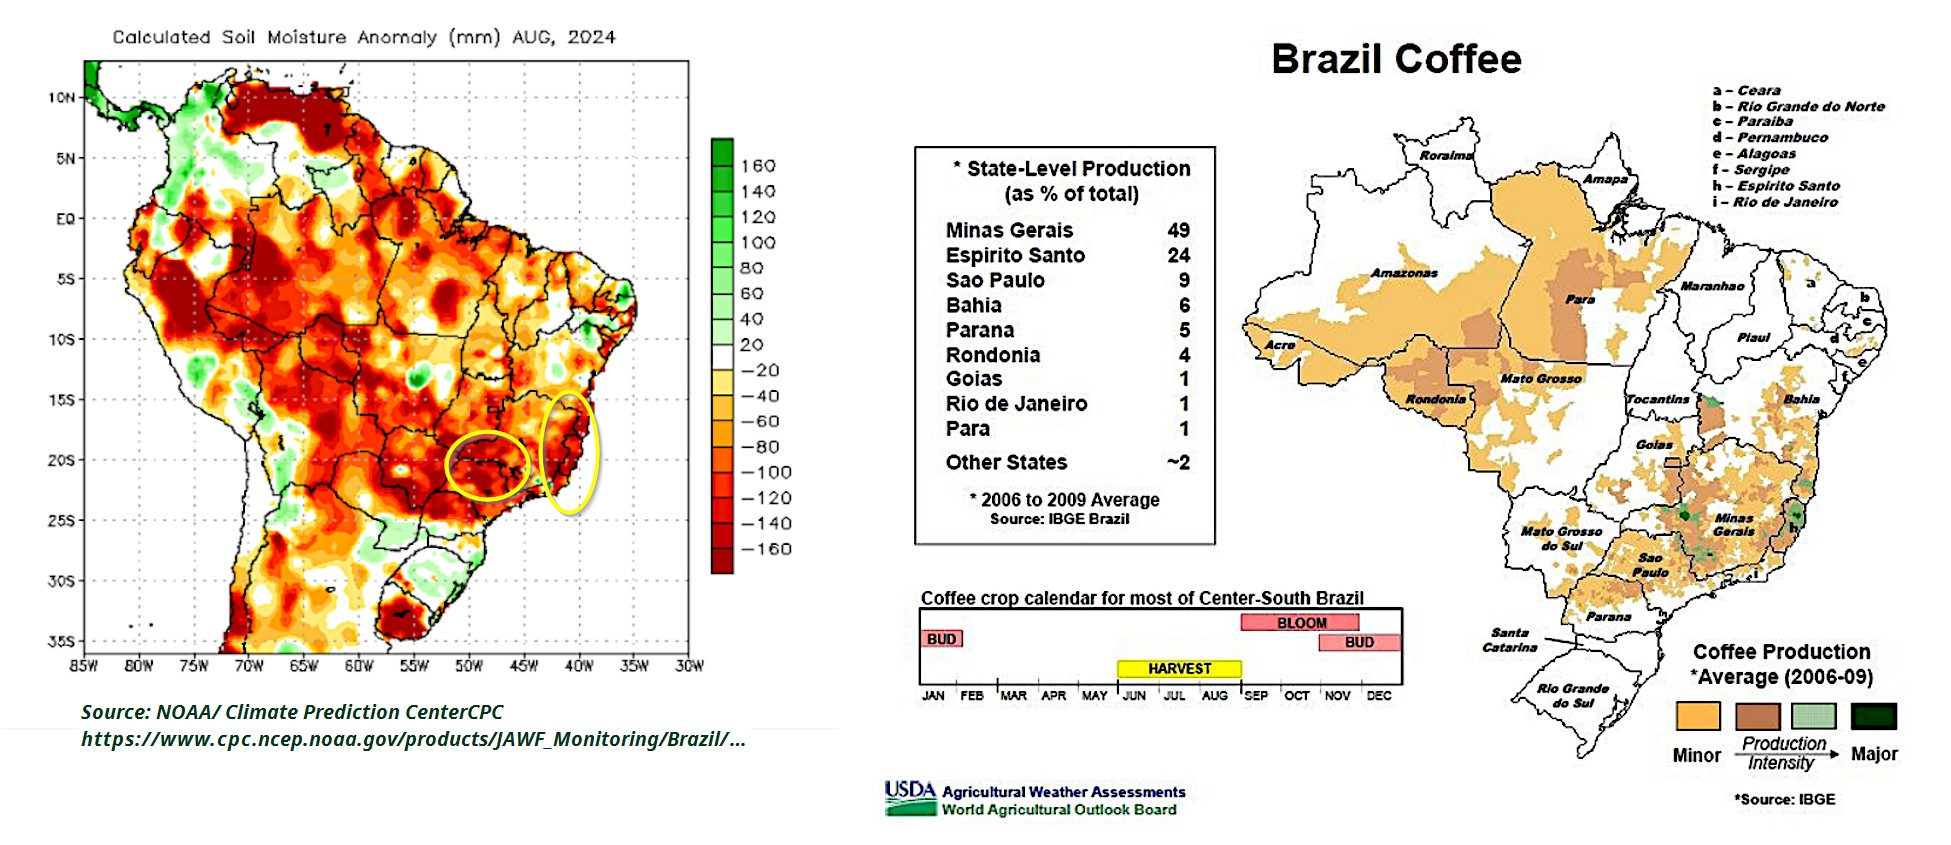
Fig.1: Soil moisture anomalies in Brazil (left) and the main coffee production regions (right, screenshot of IW Commodities Map). Sources: NOAA/CPC; USDA.
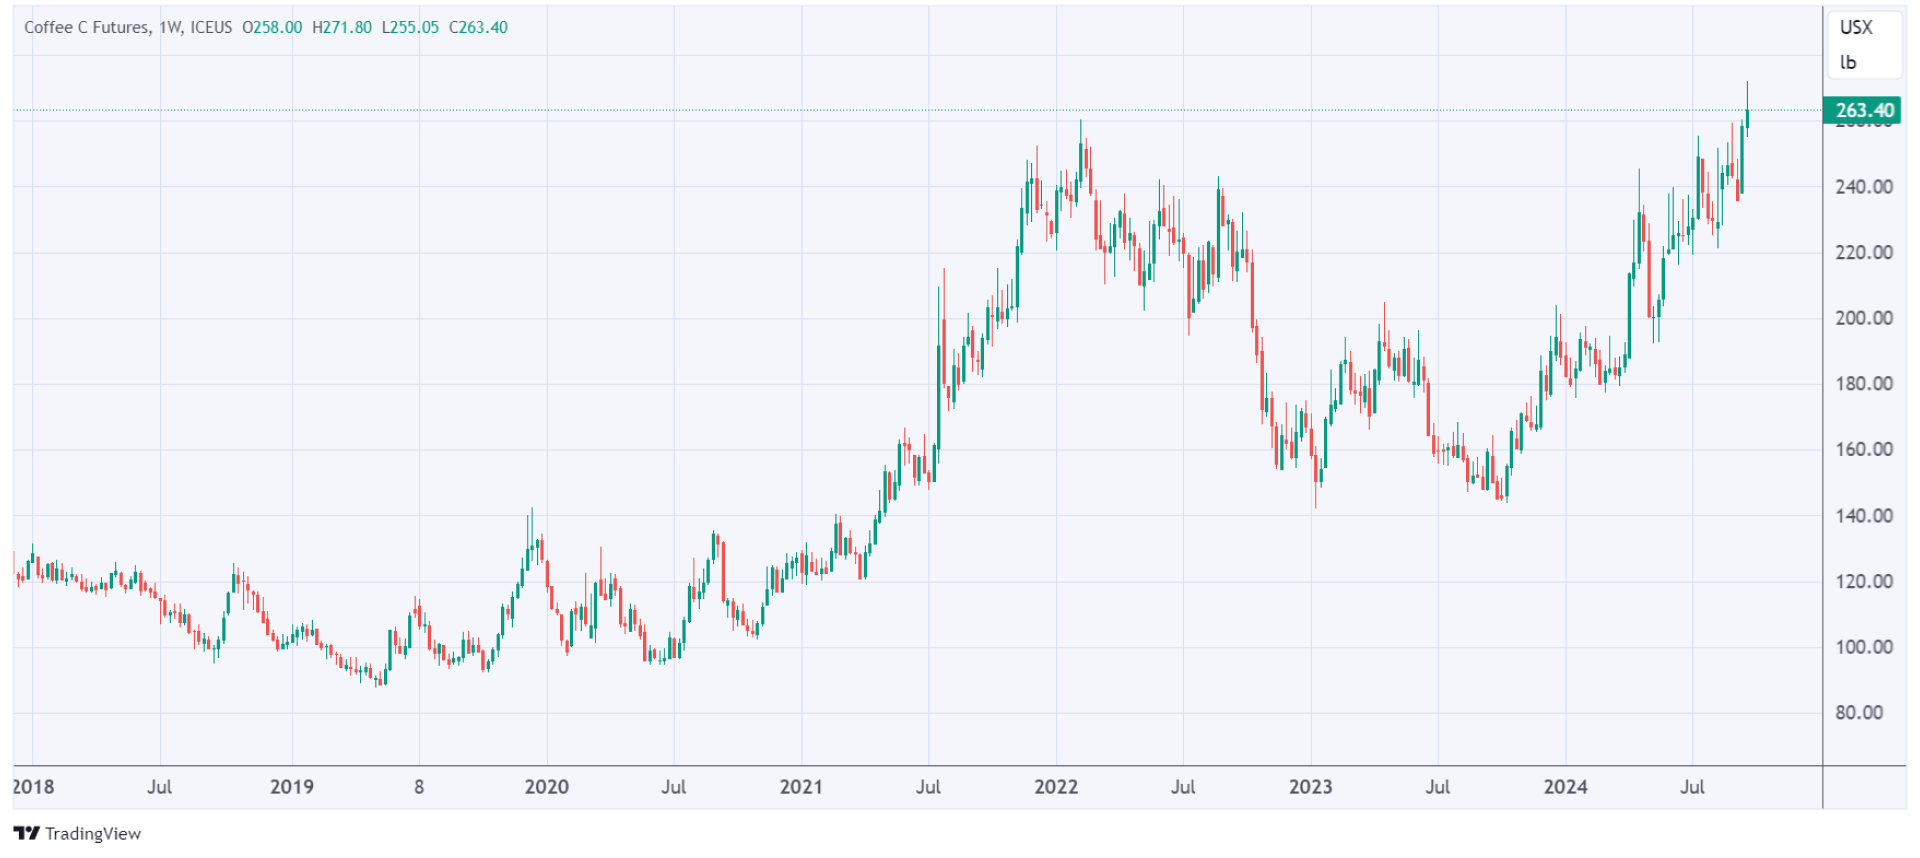
Fig.2: The Coffee Future (KC) marks an all-time high
(Side note: Andrea Illy, Chairman of IllyCaffe, recently pointed out in a Bloomberg interview that crop yields in regions such as Vietnam and Brazil will be affected by bad weather and coffee prices will continue to rise).
However, each trade must be evaluated on its own merits, as weather-related risks are often already factored into current futures prices or reflected in commercial positions. The COT report usually provides a clearer picture.
Our map gives you a more in-depth look at these dynamics. Let's explore its effective use and valuable information.
How to use the Commodities Map?
1. The world map
After launching the map, you will first see a world map with individual countries. Move the mouse over the map to see the country names.
Clicking on a country will zoom out to show its regional structure, allowing you to explore states or administrative regions by hovering over them:
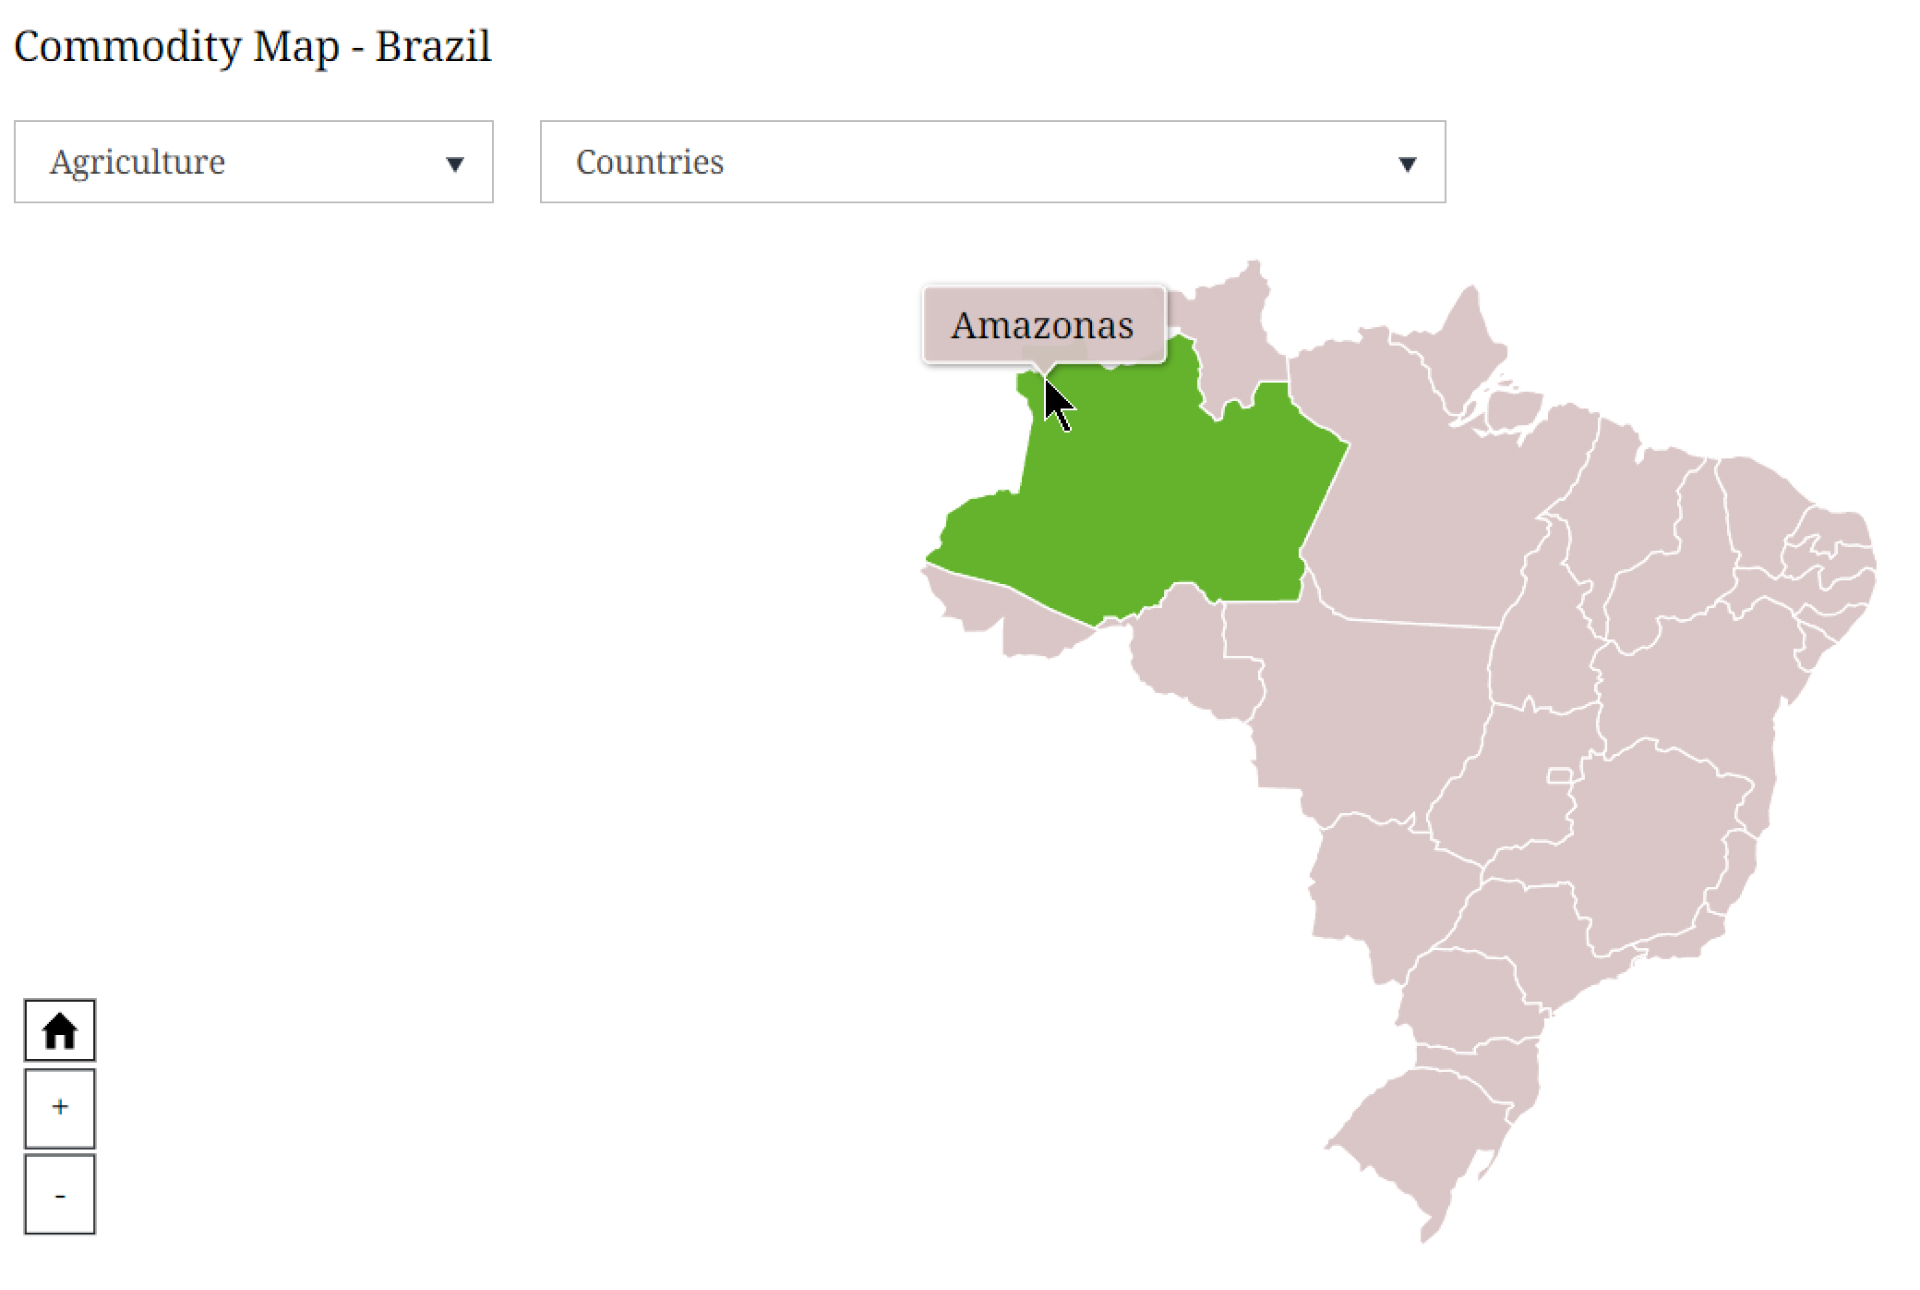
Fig.3: Federal states and administrative structures of the selected countries
2. Commodities information: Raw materials and their production regions
- Select a specific commodity from the drop-down list on the right. The map highlights the major producing countries and growing regions for that commodity.
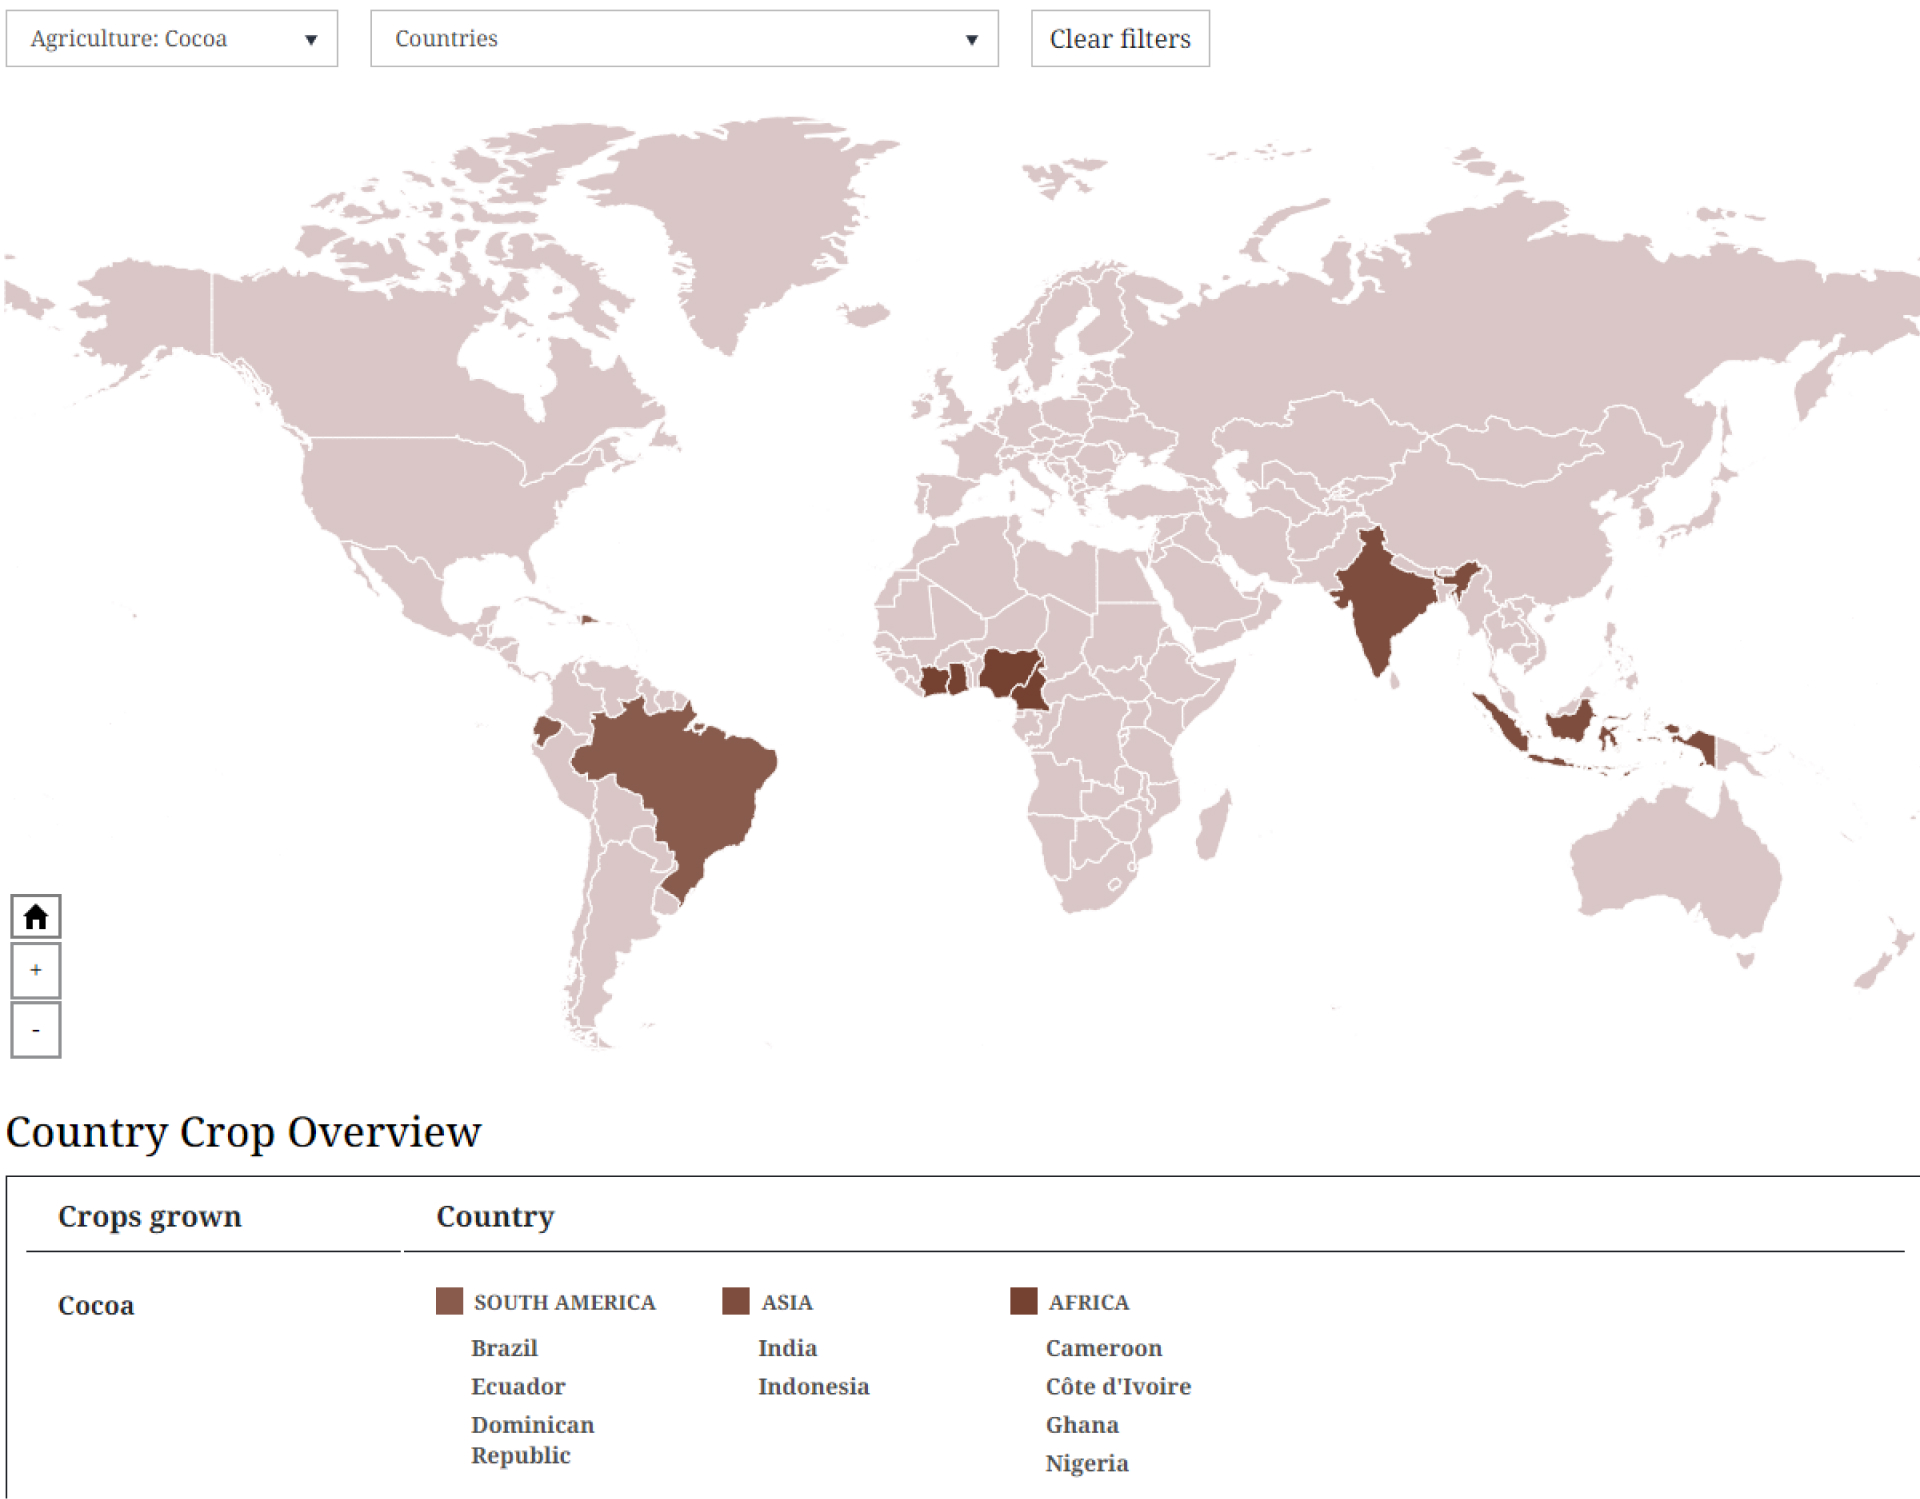
Fig.4: The most important cocoa-growing regions worldwide
An overview of the countries is provided in the table below. By selecting a country from either the list or the map, you can access more detailed information about its cultivation practices:
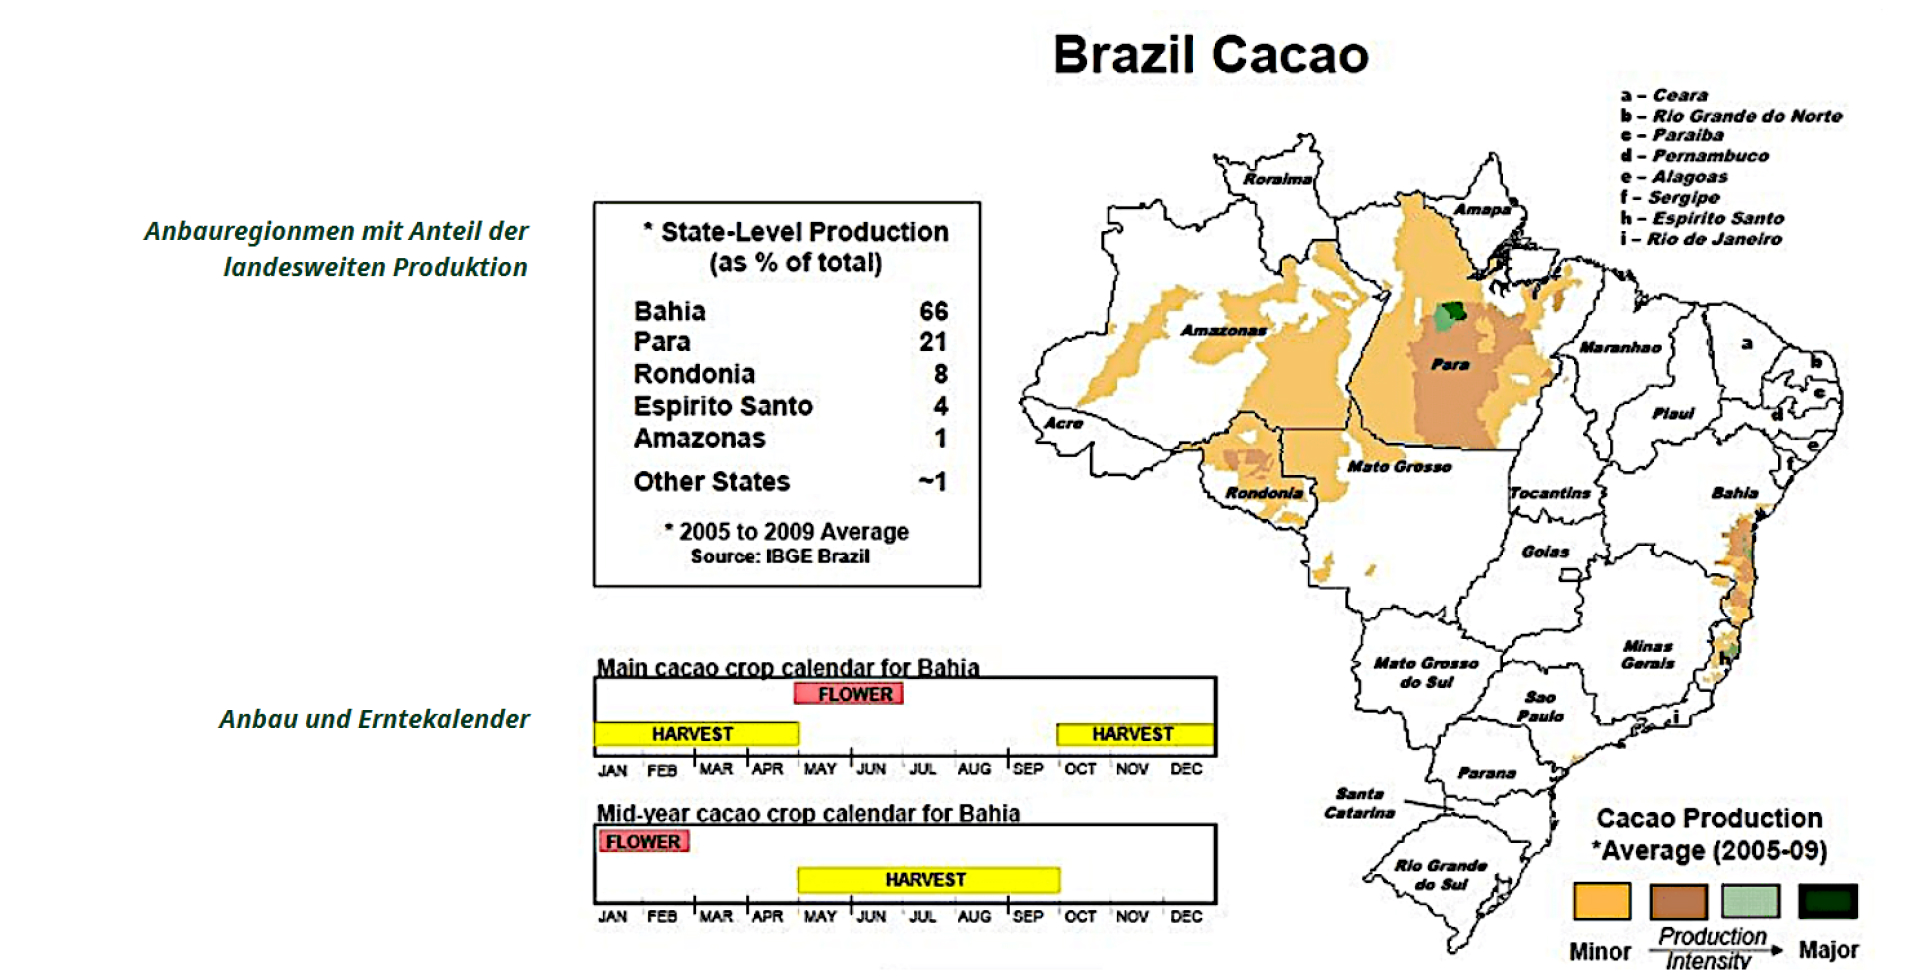
Fig.5: Regional information on the commodity – Cocoa cultivation in Brazil
The detailed map shows the regional growing areas with their average relative yields. A table shows the percentage of the national yield. In addition, a time graph outlines the growing seasons. In the example above, you can see that Brazil has two alternating growing seasons for cocoa, indicating that cocoa is in season throughout the year.
3. Country information: Key agricultural products
- Select a country and it will appear on the world map along with a list of the country's major agricultural products. As you move the mouse over the country, you will see these major products.
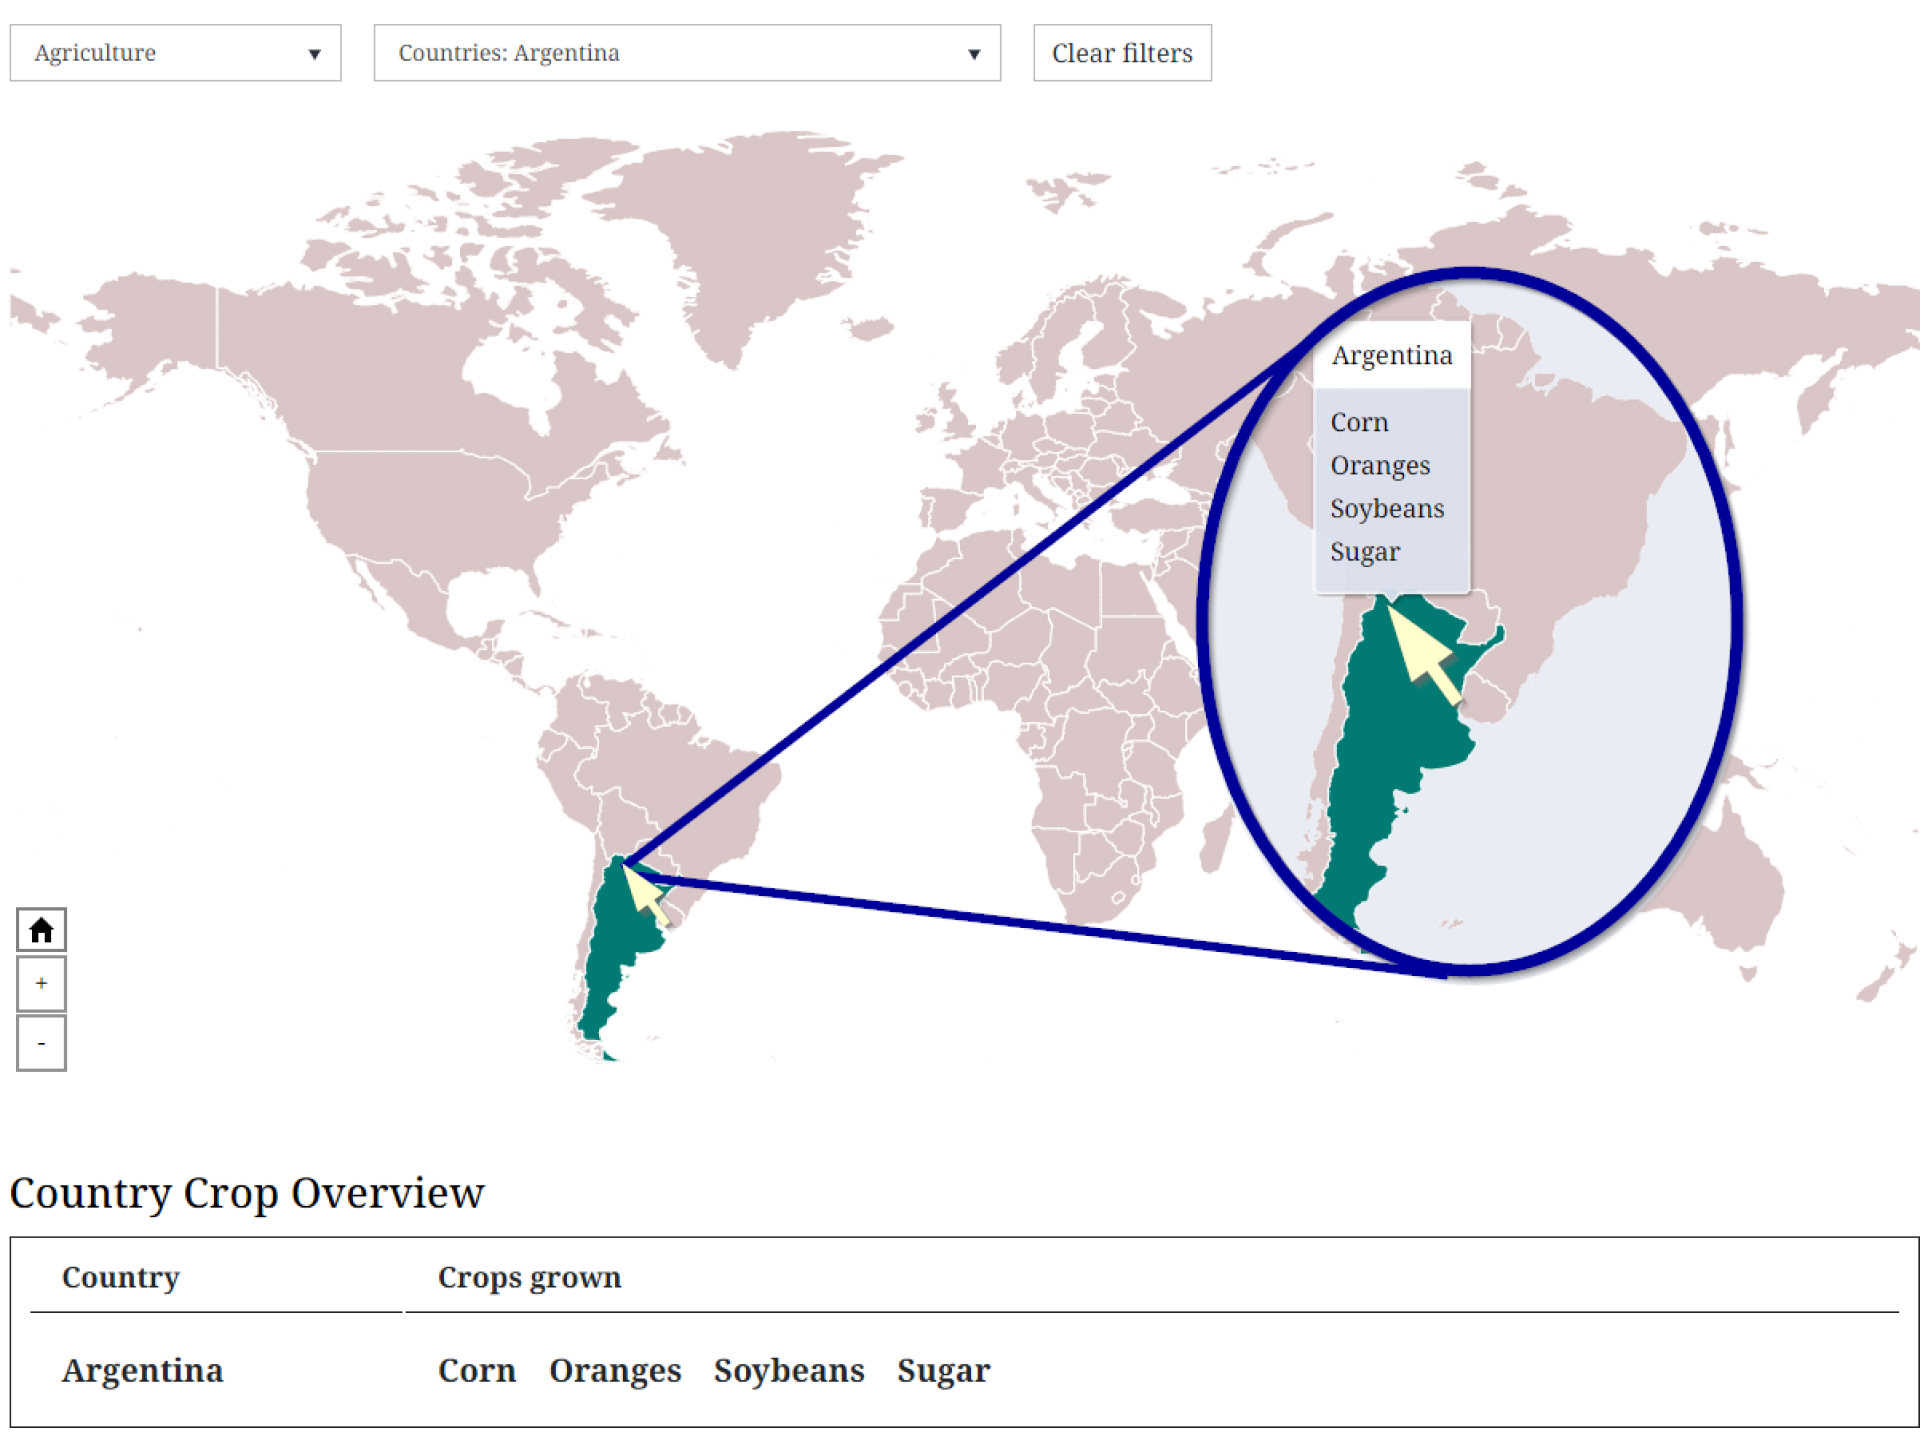
Fig.6: Selected Country - Argentina, with information on its key agricultural products
Conclusion
At this stage of development, the Commodities Map provides a global overview of the major growing areas and major agricultural products. These are the agricultural commodities that we trade futures on at InsiderWeek. While it's still a work in progress and some country-specific details are missing, we are actively working to fill those gaps.
We're also planning to add more commodity sectors to the map, including energy resources such as crude oil and natural gas, and metals such as precious metals and copper.
We invite you to explore and experiment with the map and hope it helps you in your trades.
Curious to learn more?
Get your hands on Max Schulz’s book by downloading it today! Free of charge.